General Discussion
Related: Editorials & Other Articles, Issue Forums, Alliance Forums, Region ForumsScatter Plots of states - Vaccination Rate vs COVID cases, hospitalizations, deaths (Yale)
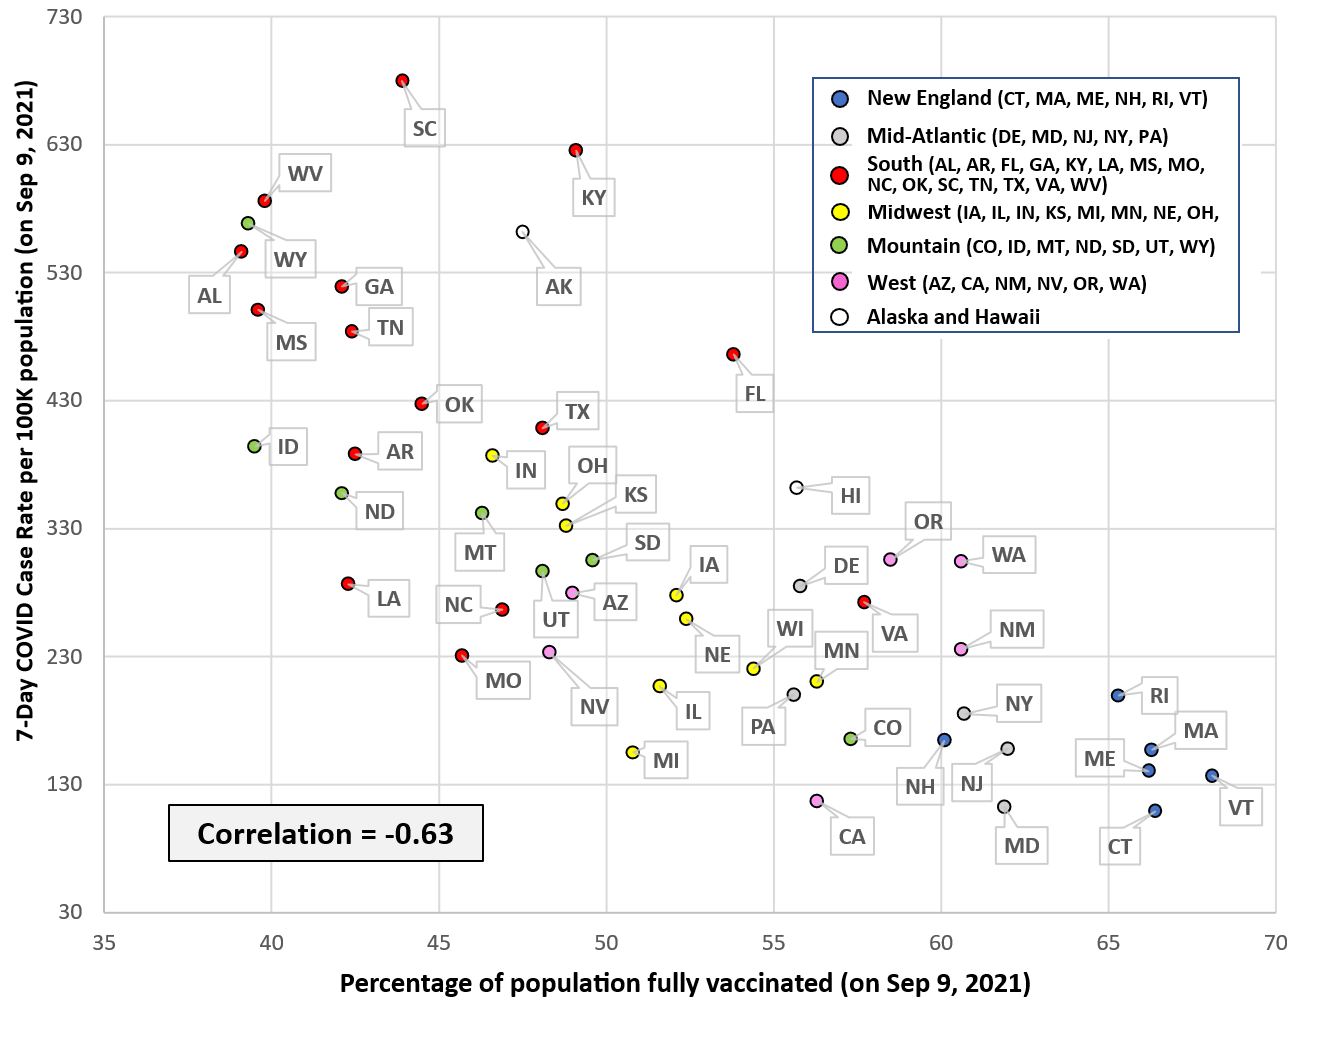
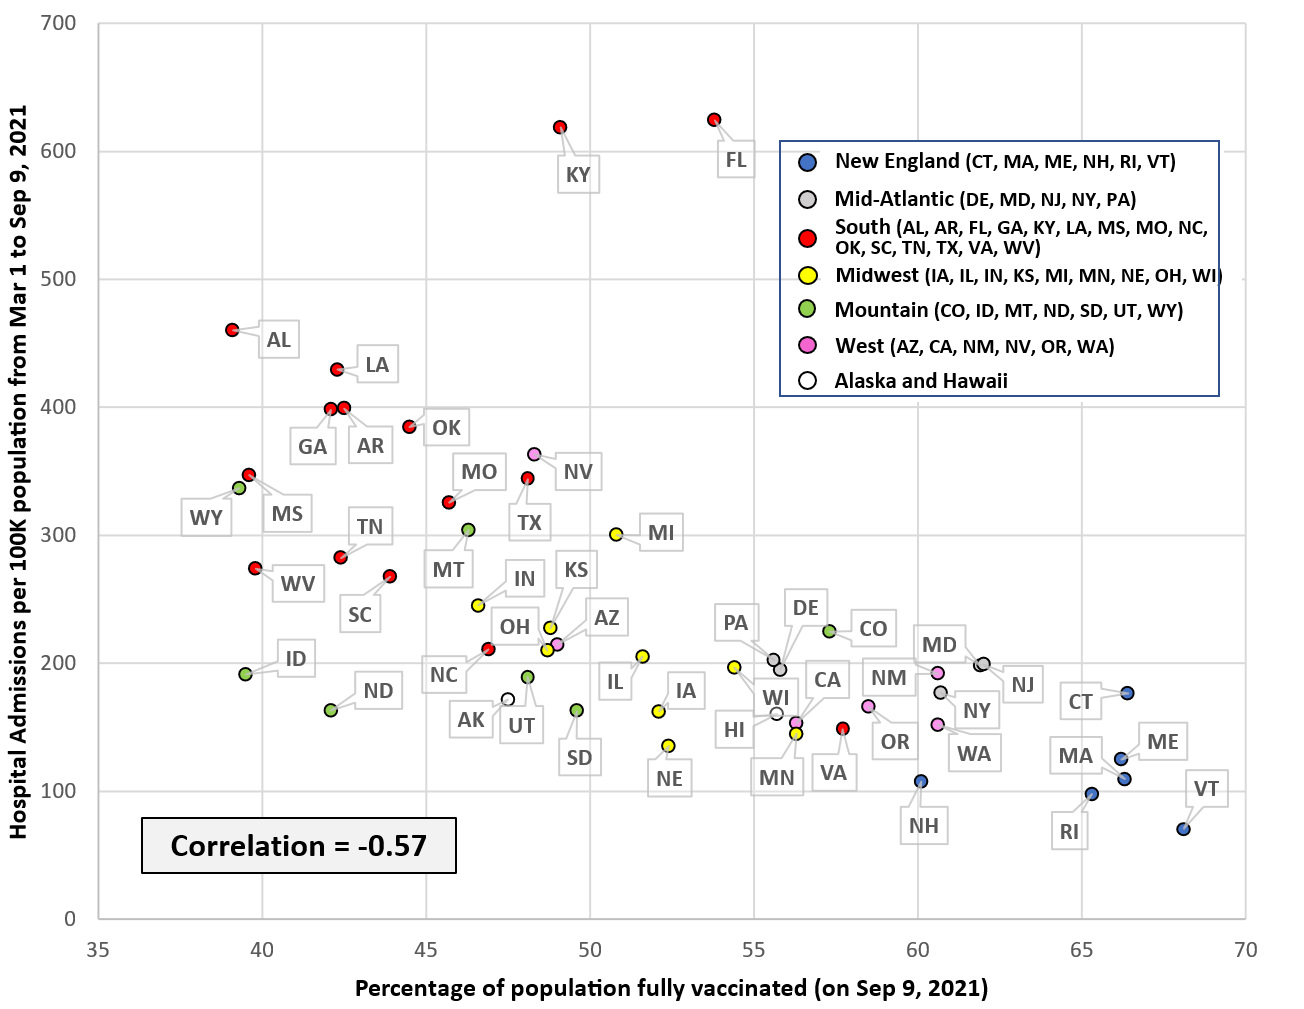
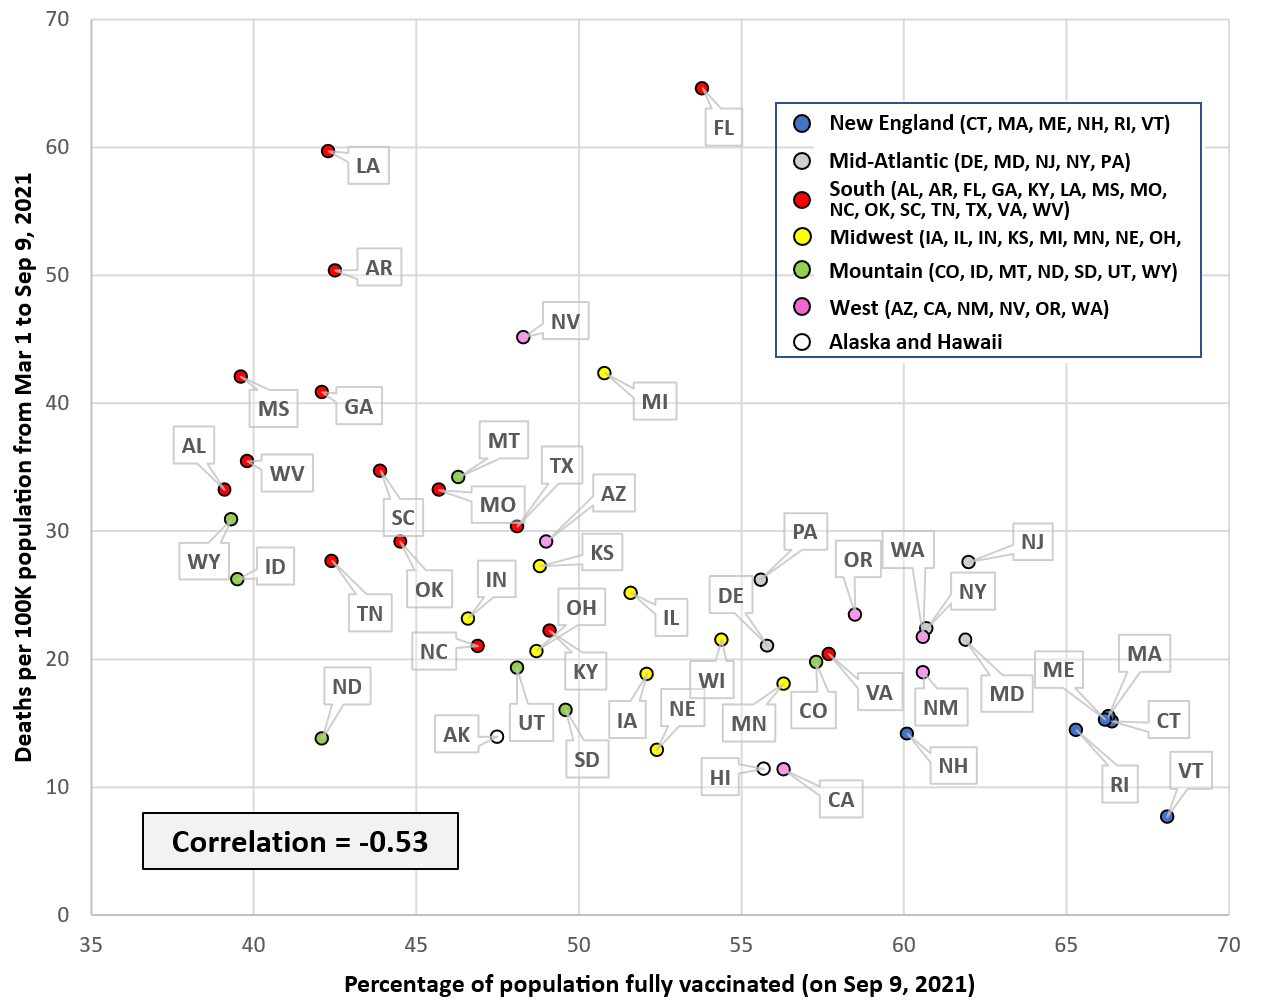
From Yale Faculty Viewpoints, article titled “Soaring COVID Rates in the South Show Why We Need Vaccine Mandates”. Correlation is obviously very strong. The case rate covers one week on Sep 9th, so it’s recent, and appropriately aligns with the Sep 9th vaccination number. The hospitalization and death rates would not line up on the calendar quite as well with the vaccine snapshot because they are composed of a 6 month period (March 1 - Sep 9), but directionally correct since the top vaccinated states were generally top vaccinated states six months ago as well.
Vaccination Rates and Seven-day Case Rates
Vaccination Rates and Hospitalization / 100K
Vaccination Rates and Deaths / 100K
https://insights.som.yale.edu/insights/soaring-covid-rates-in-the-south-show-why-we-need-vaccine-mandates
I’ve been wanting to see such charts. I’d like to also see 1) the same data as bubble charts, to be blue to quickly compare similarly sized states with opposing policies, 2) circles around states with significant mask mandates, and 3) distinction made between Democratic governors ‘ legislatures and Republican governors / legislatures. And 4) the ability to interactively look at county level data for counties of a similar size.
 = new reply since forum marked as read
Highlight:
NoneDon't highlight anything
5 newestHighlight 5 most recent replies
= new reply since forum marked as read
Highlight:
NoneDon't highlight anything
5 newestHighlight 5 most recent replies

Wounded Bear
(58,648 posts)berni_mccoy
(23,018 posts)wendyb-NC
(3,325 posts)
Scrivener7
(50,949 posts)
Mr.Bill
(24,284 posts)and says all the data is fake.
But then most of them could not grasp the complexity of the graphs.

AZLD4Candidate
(5,688 posts)Arizona is middling in the middle. We here in Arizona deserve better than Gov. Maple Walnut and the rest of his ilk in the Lege.

hlthe2b
(102,239 posts)
TheRickles
(2,061 posts)The "all-cause mortality" chart (total deaths, regardless of how they are classified) is pretty revealing. The current delta surge is most dramatic in states like Florida and Texas and Mississippi, where the governors are not taking it seriously.
https://www.cdc.gov/nchs/nvss/vsrr/covid19/excess_deaths.htm
Select a Dashboard: Weekly Excess Deaths
Select a Jurisdiction: pick any state, or see US as a whole
Anything above the orange line represents a significant increase in the death rate. It takes a few weeks for all the data to be reported and tabulated, so despite the apparent dip in the graphs, those states are not showing a fall-off. Yet.

lostnfound
(16,178 posts)Glaisne
(515 posts)I'm so glad I live in a blue state.

FoxNewsSucks
(10,429 posts)And the general attitude is really bad for your mental state. I wish I could move to a nice blue state like Vermont.

ProfessorGAC
(65,013 posts)The vax rate is middle of the pack, but they are very distant from any correlation line on all three charts.
They are the highest value on both the hospitalization & death rate charts. (Although there are 10 states higher in cases per 100k.)
But, they're around 55% vaxxed.
I'm surmising the demographics of their vaxxed population (very high % among seniors & very low in less populated areas), on top of the delta hitting younger people has something to do with their dramatic variance from the overall correlation.
Not enough info on these 3 simple to understand charts to do any more than guess.
paleotn
(17,912 posts)Older population, but so is Vermont, Maine and WV. Are older people less healthy in FL in general than similar aged folks in other states, thus they have more contributory factors? Hell, maybe it's handling the cold winters. They're just made of sterner stuff. Maybe it's just goofiness in the data, unrelated to the measures.

LisaL
(44,973 posts)There is only so much a vaccine can do.
drray23
(7,627 posts)was that it might be because their reporting is skewed. We have heard a lot of reports about Florida fudging the numbers.
LisaL
(44,973 posts)In other words, their death rate is worse than their vaccination numbers indicate it should be.
I presume that is connected to their governor and total lack of current covid precaution measures.
ProfessorGAC
(65,013 posts)First, if they were fudging the numbers it would be a worse outlier. It would push them even higher up the chart and away for the rest of the correlated data. So, that doesn't explain its outlier status.
Second, the numbers being "fudged" were deaths. They tried to be sneaky by reporting deaths every 5 to 7 days, so there's days of zero. But, they end up reporting deaths anyway. It's stupid, but they did it.
paleotn
(17,912 posts)Roughly the middle of the vaccination range, yet way higher hospitalization and death rates than other states with similar vaccination levels. Older population, granted, but so is VT and ME. In fact, the average age is older in VT and ME. Same with WV. WV's vaccination rate is much lower than FL, but hospitalizations and deaths are similar to other states in their region of the vaccination range. Weird.
CaptainTruth
(6,589 posts)...refuses to impose mitigation measures, which I think is why we have so many cases, hospitalizations, & deaths.

Dreampuff
(778 posts)Not only does our so-called governor refuse to impose helpful measures, he has made laws to prevent others from doing so. School districts, private businesses, tourism industry, Etc.
Honestly, it is like he has a death wish for all of us. One of the very people who is supposed to be protecting the residents, citizens.
Moebym
(989 posts)Trying to make sense of some of these...
My state, Nevada, has a Democratic governor and a majority female and majority Democratic state legislature whereas SD has Governor Noem, a Republican-controlled state lege and the infamous Sturgis motorcycle rally. Yet SD has a slightly higher % of its population vaccinated and is lower than us on every metric except the 7-day case rate.
Must be their lower population density...
erronis
(15,241 posts)they will warp their numbers to match their top politico's needs.
TheRickles
(2,061 posts)That's why Total Deaths is such a good variable to follow, esp. in red states. It can't be fudged, ie whether Covid was or was not the cause. But it still gets tallied sooner or later.
