General Discussion
Related: Editorials & Other Articles, Issue Forums, Alliance Forums, Region ForumsVisual Learner Poll Revisited
http://electoral-vote.com/Before Final Debate
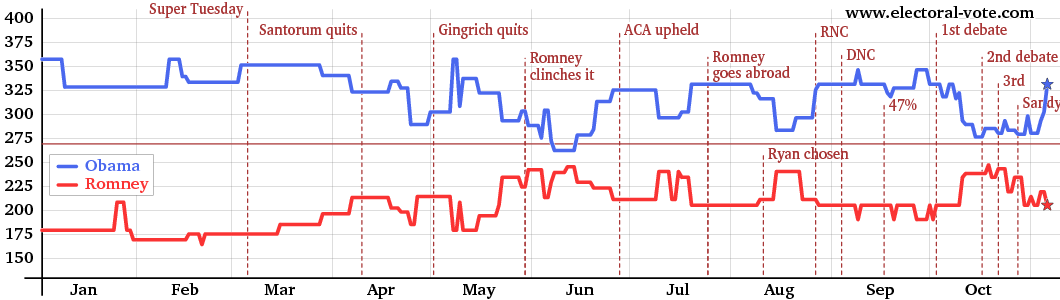
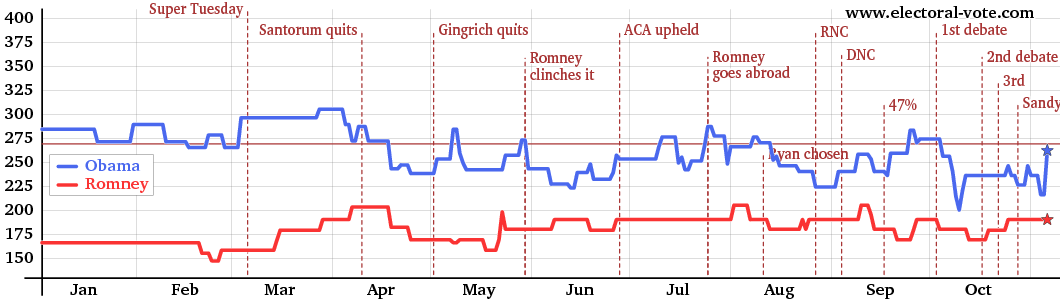
Electoral College 2012 Excluding States Where the Candidates are Statistically Tied
The third and final presidential debate will take place tonight at Lynn University in Boca Raton, FL. It will be about international relations and foreign policy. The format will be the same "parallel job interviews" format used in the first debate. Bob Schieffer of CBS will try to moderate it.
Schieffer has announced that the debate will be broken into six segments, each starting with a question from him. The topics of the questions are as follows.
America's role in the world
Our longest war - Afghanistan and Pakistan
Red lines: Israel and Iran
The changing Middle East and the new face of terrorism I
The changing Middle East and the new face of terrorism II
The rise of China and tomorrow's world
http://electoral-vote.com/evp2012/Pres/ec_graph-2012.html
 = new reply since forum marked as read
Highlight:
NoneDon't highlight anything
5 newestHighlight 5 most recent replies
= new reply since forum marked as read
Highlight:
NoneDon't highlight anything
5 newestHighlight 5 most recent replies

mike_c
(36,281 posts)...but the bottom figure still has the magic line at 270 electoral votes. Shouldn't it be reduced if some states (and their electors) are eliminated from the data?

littlemissmartypants
(22,700 posts)please...
mike_c
(36,281 posts)The top figure has a horizontal line at 270 electoral votes, the number needed to win the electoral college. The Obama and Romney lines are most relevant in comparison to that "magic number" of 270 electors, and you can see how the race has tightened in recent weeks as Obama's count of electoral votes dips and Romney's climbs closer.
In the bottom figure the states near statistical ties are removed, and both Obama's and Romney's predicted number of electoral votes is lowered because those states and their electors were removed from the data. But the line representing the magic number needed to win remains at 270, even though some number of states, and their electors, were taken out of the data. That line is meaningless in the lower figure.

tritsofme
(17,380 posts)Changing it would be arbitrary and meaningless.
The second image shows statistical ties removed, but still shows how close the candidates are to reaching the magic among with only states they have locked up. It shows that Obama has a much smaller lift to get to 270 than Romney.
mike_c
(36,281 posts)Not sure I understand the relevance of that in light of the top graph though, which suggests that Obama already HAS the necessary electoral votes, so where's the lift? Or is the top figure more fantasy than the bottom? I'm not sure I understand the utility of that, if true. Something still doesn't seem right about the contrast between those two figures.
However, I'm not gonna sit here in the office wondering about it any longer. I'm off!