Welcome to DU!
The truly grassroots left-of-center political community where regular people, not algorithms, drive the discussions and set the standards.
Join the community:
Create a free account
Support DU (and get rid of ads!):
Become a Star Member
Latest Breaking News
General Discussion
The DU Lounge
All Forums
Issue Forums
Culture Forums
Alliance Forums
Region Forums
Support Forums
Help & Search
General Discussion
Related: Editorials & Other Articles, Issue Forums, Alliance Forums, Region ForumsMicrosoft Mapped Broadband Affordability Gaps Because The U.S. Government Couldn't Be Bothered To
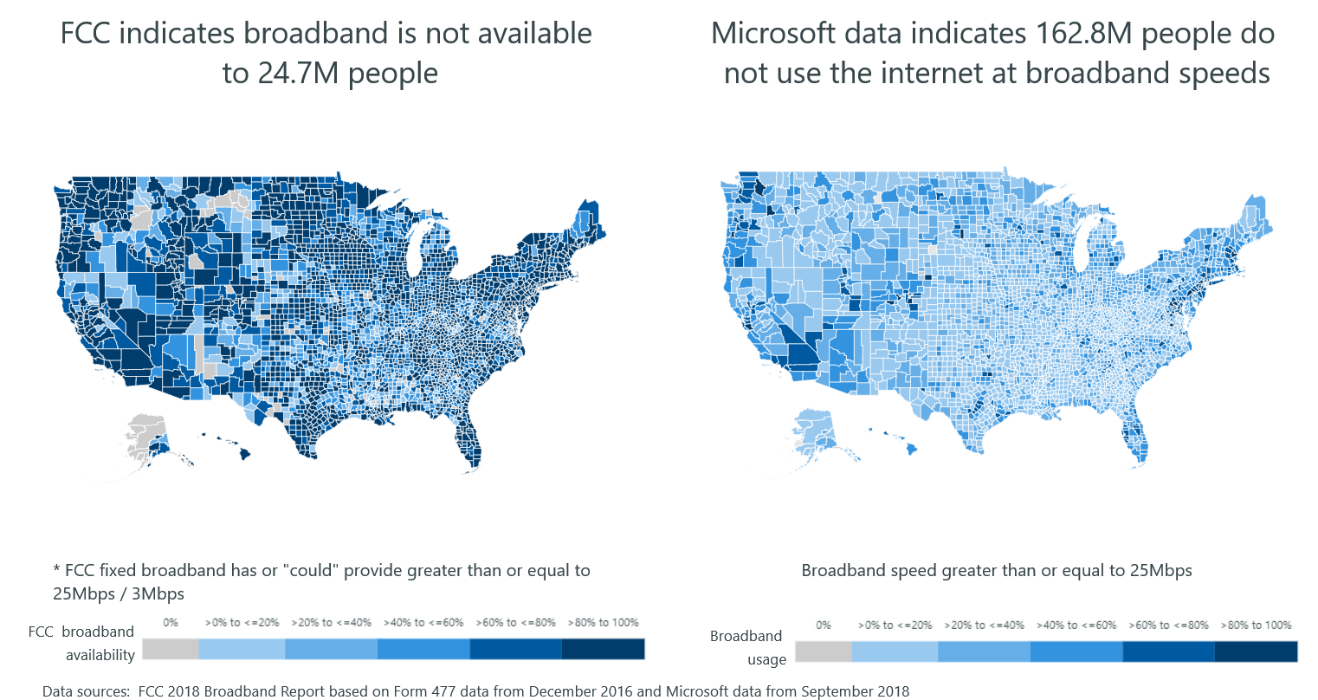
https://www.techdirt.com/2022/07/15/microsoft-mapped-broadband-affordability-gaps-because-the-u-s-government-couldnt-be-bothered-to/?fbclid=IwAR3qSmXI4YFCZVFdVh94oa28ejz_YwtRlOegkoxibruahS0HMN96wft101IU.S. taxpayers have spent more than $350 million for FCC broadband maps that overstate broadband availability and speeds, downplay widespread monopolization and consolidation, and can’t even be bothered to measure affordability, one of the biggest obstacles to widespread adoption.
You only need to spend a few minutes to plug your address into the FCC’s broadband mapping website to see how the government data all but hallucinates competitors and speeds. Bad data makes it easier for entrenched broadband monopolies (and the regulators, lawmakers, think tankers, consultants, lobbyists, and academics paid to love them) to downplay pretty obvious market failure.
Fortunately there’s starting to finally be some movement on this problem. In 2019, Congress passed the Broadband DATA Act, which demands the FCC do a better job verifying broadband data coming from ISPs, use a broader selection of data sources, and stop using dumb, flawed methodology (the FCC long declared an entire census block “served” with broadband if just one home in that block could get service).
The FCC’s maps historically also haven’t been willing to map broadband prices and affordability. To that end, the NTIA has been doing some good work trying to illustrate broadband affordability gaps, again caused by regional monopolization.
As has Microsoft, which, last week, offered an updated look at digital equity, a measurement that heavily integrates broadband availability and affordability:
The new tool was developed by Chief Data Science Officer Juan Lavista Ferres and the Microsoft AI for Good Lab, and aggregates public data from the Census Bureau, Federal Communications Commission (FCC), BroadbandNow and Microsoft’s own Broadband Usage Data.
It goes census tract-by-census tract, examining 20 different indicators of digital equity – such as broadband access, usage, education and poverty rates – to create one of the most complete pictures of digital equity in these areas to date.
The full Microsoft dashboard is interesting and worth a look. And it reiterates some important realities, such as the fact that the “digital divide” isn’t just a problem for remote, rural areas:
It’s important to understand that for thirty years, government broadband data has helped downplay the real problem in U.S. telecom: regional monopolization, mindless consolidation, and the state and federal corruption that protects it.
But bad data doesn’t just help obscure the impact of monopoly and duopoly power.
Entrenched broadband giants actively exploit the bad data to block government funding to competitors or innovative new cooperative and utility-based community broadband ventures...
And while it’s great the FCC appears to have finally gotten the message, much of this money is coming after we’ve started distributing more than $50 billion in COVID relief and infrastructure broadband funding. And there are already complaints that telecom monopolies will still be able to exploit the new mapping system to falsely inflate broadband coverage or block funding going to competitors.
You can’t fix a problem you can’t measure, and it’s absolutely gobsmacking that we’re thirty-plus years into the broadband revolution and the wealthiest country on the planet still can’t accurately measure the problem we’re trying to fix.
You only need to spend a few minutes to plug your address into the FCC’s broadband mapping website to see how the government data all but hallucinates competitors and speeds. Bad data makes it easier for entrenched broadband monopolies (and the regulators, lawmakers, think tankers, consultants, lobbyists, and academics paid to love them) to downplay pretty obvious market failure.
Fortunately there’s starting to finally be some movement on this problem. In 2019, Congress passed the Broadband DATA Act, which demands the FCC do a better job verifying broadband data coming from ISPs, use a broader selection of data sources, and stop using dumb, flawed methodology (the FCC long declared an entire census block “served” with broadband if just one home in that block could get service).
The FCC’s maps historically also haven’t been willing to map broadband prices and affordability. To that end, the NTIA has been doing some good work trying to illustrate broadband affordability gaps, again caused by regional monopolization.
As has Microsoft, which, last week, offered an updated look at digital equity, a measurement that heavily integrates broadband availability and affordability:
The new tool was developed by Chief Data Science Officer Juan Lavista Ferres and the Microsoft AI for Good Lab, and aggregates public data from the Census Bureau, Federal Communications Commission (FCC), BroadbandNow and Microsoft’s own Broadband Usage Data.
It goes census tract-by-census tract, examining 20 different indicators of digital equity – such as broadband access, usage, education and poverty rates – to create one of the most complete pictures of digital equity in these areas to date.
The full Microsoft dashboard is interesting and worth a look. And it reiterates some important realities, such as the fact that the “digital divide” isn’t just a problem for remote, rural areas:
The dashboard also confirms what we have long known: the digital divide isn’t just felt in rural areas – it also deeply impacts cities. In Los Angeles County, where we’re working with partner Starry to expand access to affordable broadband, more than a quarter of residents aren’t using the internet at broadband speeds, and roughly one in five households lacks a desktop or laptop computer, cutting off millions from the digital world.
It’s important to understand that for thirty years, government broadband data has helped downplay the real problem in U.S. telecom: regional monopolization, mindless consolidation, and the state and federal corruption that protects it.
But bad data doesn’t just help obscure the impact of monopoly and duopoly power.
Entrenched broadband giants actively exploit the bad data to block government funding to competitors or innovative new cooperative and utility-based community broadband ventures...
And while it’s great the FCC appears to have finally gotten the message, much of this money is coming after we’ve started distributing more than $50 billion in COVID relief and infrastructure broadband funding. And there are already complaints that telecom monopolies will still be able to exploit the new mapping system to falsely inflate broadband coverage or block funding going to competitors.
You can’t fix a problem you can’t measure, and it’s absolutely gobsmacking that we’re thirty-plus years into the broadband revolution and the wealthiest country on the planet still can’t accurately measure the problem we’re trying to fix.
(Throwing this in for the halibut.)
InfoView thread info, including edit history
TrashPut this thread in your Trash Can (My DU » Trash Can)
BookmarkAdd this thread to your Bookmarks (My DU » Bookmarks)
0 replies, 686 views
ShareGet links to this post and/or share on social media
AlertAlert this post for a rule violation
PowersThere are no powers you can use on this post
EditCannot edit other people's posts
ReplyReply to this post
EditCannot edit other people's posts
Rec (15)
ReplyReply to this post