General Discussion
Related: Editorials & Other Articles, Issue Forums, Alliance Forums, Region Forums
 = new reply since forum marked as read
Highlight:
NoneDon't highlight anything
5 newestHighlight 5 most recent replies
= new reply since forum marked as read
Highlight:
NoneDon't highlight anything
5 newestHighlight 5 most recent replies
CentralMass
(15,265 posts)The national debt is $18.1 trillion dollars. On this date in 2008, it was $9.7 trillion.
That is an $8.4 trillion dollar increase over the last 7 years.
wildbilln864
(13,382 posts)CentralMass
(15,265 posts)He for he most part has kept his predecessors fiscal policies.
I suspect your numbers on Clinton are wrong . From memory G.H.W Bush left him with a deficit budget of ~$5.6 trillion with a budget that had been bleeding deficits for 3 presidential terms. His polices reversed the bleeding and he left office with a national debt of ~$5.7 trillion.

Angleae
(4,491 posts)I can't find the exact number for January 1992 but on 09/30/1992 it was $4,064,620,655,521.66
arcane1
(38,613 posts)I admit it doesn't do much by itself.
CentralMass
(15,265 posts)budget surpluses in 4 decades.
Yorktown
(2,884 posts)
Dawgs
(14,755 posts)History grades by President, not by Congress. It has always been that way, and there's no reason to think it will change anytime soon.
Yorktown
(2,884 posts)?

progree
(10,910 posts)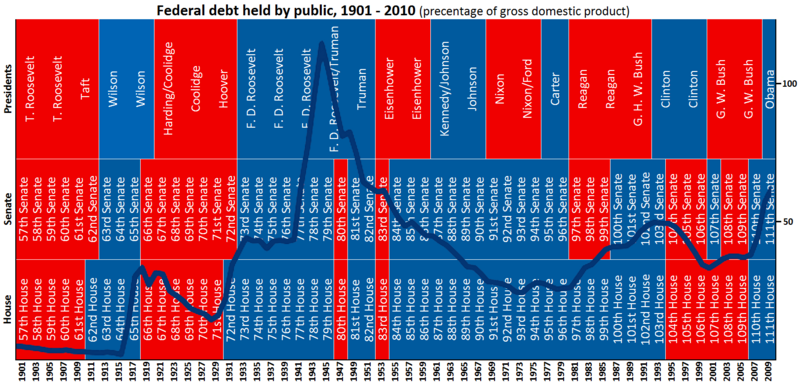
Unfortunately, it only goes through 2010 so I'll update:
2011, 2012, 2013, 2014: [font color = red]Rep House[/font], [font color = blue]Dem Senate, Dem President[/font]
2015, 2016: [font color = red]Rep House, Rep Senate[/font], [font color = blue]Dem President[/font]
And at the end of 2014, the debt to GDP ratio was 101%. (at the end of 2010, when the Dems still controlled everything, the debt/GDP ratio was 92.1%, according to the FRED graph below, so the graph above should show the debt/GDP line ending at 92.1%)
FRED's Debt/GDP graph through Q3 2014 (but without who controlled what). Sorry you'll have to click, I don't know how to embed FRED graphs in DU:
http://research.stlouisfed.org/fred2/series/GFDEGDQ188S?cid=5
progree
(10,910 posts)# URL: http://www.treasurydirect.gov/NP/BPDLogin?application=np
# Under Reagan the debt nearly tripled (2.87 X)
# Under Bush I the debt increased by 56% (1.56 X)
# Under Bush II the debt nearly doubled (1.86 X)
# The debt under the two Bushes together nearly tripled -- it increased 1.56 * 1.86 = 2.89 X
# The last 3 Republican presidents (Reagan and the two Bushes) increased the national debt by 2.87 * 1.56 * 1.86 = 8.3 times, yes they more than octupled the national debt in their combined 20 years of office.
# Under Clinton the debt only increased 37% (1.37 X)
# Secret information: Under Obama the national debt increased 70% in his 6.0 years of office. You might see claims that he increased the national debt by 95% or that he has doubled it -- if so, they are talking about the "debt held by the public" which is one of two components of the national debt. The other component is the Intragovernmental Debt: what one part of the federal government owes to another part of the government -- mostly the Social Security and the Medicare trust funds.
[div style="display:inline; font-size:1.37em; font-family:monospace; white-space:pre;"] National Debt in Billions of Dollars
[div style="display:inline; font-size:1.37em; font-family:monospace; white-space:pre;"]
[div style="display:inline; font-size:1.37em; font-family:monospace; white-space:pre;"] Public IntraGov Total
[div style="display:inline; font-size:1.37em; font-family:monospace; white-space:pre;"]1/20/2009 6,307 4,320 10,627 Obama inaugurated
[div style="display:inline; font-size:1.37em; font-family:monospace; white-space:pre;"]1/31/2015 12,985 5,097 18,083 Present
[div style="display:inline; font-size:1.37em; font-family:monospace; white-space:pre;"]
[div style="display:inline; font-size:1.37em; font-family:monospace; white-space:pre;"]% Increase 106% 18% 70%
[div style="display:inline; font-size:1.37em; font-family:monospace; white-space:pre;"]Public: debt held by the public. Intragov: Intragovernmental debt
# URL: http://www.treasurydirect.gov/NP/BPDLogin?application=np
# Factoid number two is when comparing the debt to GDP version of different countries to each other, economists don't usually include intragovernmental debt {citation needed}. So when some rightie says that we are almost at a 100% debt to GDP ratio -- approaching that of some of the in-trouble European countries, point out that the equivalent debt for comparison is the Publicly held debt: 12,771 B$. The latest GDP number (2014 Q3 release 2) as of 12/5/14 is 17,555 B$ (http://www.bea.gov/newsreleases/national/gdp/gdpnewsrelease.htm). Thus the debt to GDP ratio on this basis is: 12,946 / 17,555 = 74%. (Using the total national debt, the debt to GDP ratio is 17,994 / 17,555 = 103%). (This paragraph was accurate on 12/5/14. I'm not going to go through the work right now of updating it for this posting -- I'd also have to dig out the latest GDP which is 2014 Q4 release 1 )
See the back of The Economist magazine where they compare Debt / GDP ratio of several countries (and many other statistics). I can't find those numbers at the Economist site online (I didn't look real hard) but I found a graph at http://www.economist.com/blogs/graphicdetail/2012/01/daily-chart-8 (click on the GOVERNMENT tab)
as I read the graph for the U.S. it is 80%, so I'll have some figuring out to do (why is it not closer to the 73% I calculated by the above methodology at the time -- the economist link above is dated Sept 2012).
# Uncomfortable Factoid To be Aware Of - The national debt during the Bush II administration increased from 5,728 B$ to 10,627 B$, an increase of 4,899 B$. The debt during the Obama administration has increased from 10,627 B$ to 18,083 B$, an increase of 7,456 B$ -- a larger dollar increase ($2.6 trillion more) in 6 years than in G.W. Bush's 8 years.
However, under G.W. Bush, the accumulation of debt was totally unnecessary and pointless -- the last 4 years under his predecessor (Clinton) were all years of budgetary surplus. Bush quickly returned us to budget deficits and debt accumulation via massive tax cuts, 2 wars (one based on lies about weapons of mass destruction), and the Medicare Part D drug benefit (which was written by and for the insurance and drug companies and forbid Medicare from negotiating prices with the drug companies!!) -- all of which were totally unpaid for (unlike Obamacare which the non-partisan Congressional Budget Office -- the official arbiter of the fiscal cost of legislation -- scores as creating a slight 10-year surplus through cuts elsewhere and to a wide assortment of fees and taxes). Whereas the debt increase under Obama was to stop the plunging economy he inherited (4.3 million jobs lost in the last 10 months of the Bush admimistration) and to get the economy pointed in the right direction.
National Debt as Percent of GDP
January 1, 2001: 56.8 % (19 days before Clinton left office and Bush took office)
December 4, 2014: 102.5 % (17,994 / 17,555) (a couple months out of date)
In 13.9 years the debt as a percent of GDP has almost doubled (1.80 X)
Italy with a debt to GDP ratio of 120% (Feb. 26, 2013) is one of the five "PIIGS" countries of the European debt crisis (well, add Cyprus now). Thanks to the unpaid-for tax cuts and 2 wars on the national credit card, the Medicare Part D give-away to the pharmaceutical companies and the Great Recession, G.W. Bush!
http://research.stlouisfed.org/fred2/series/GFDEGDQ188S?cid=5
http://research.stlouisfed.org/fred2/data/GFDEGDQ188S.txt
National Debt as Percent of GDP
62.7% 1993 Q1 - When Bush I left office and Clinton took office
54.9% 2001 Q1 - When Clinton left office and Bush II took office
77.4% 2009 Q1 - When Bush II left office and Obama took office
101.5% 2014 Q3 - latest on this graph

madville
(7,412 posts)More specifically the House, so whatever deficits or surpluses materialize primarily rest on their shoulders since they control the purse strings.
Dawgs
(14,755 posts)progree
(10,910 posts)Last edited Tue Feb 3, 2015, 01:20 PM - Edit history (1)
his/her party, he/she leads in determining the spending priorities. (Even when his party is in the minority in Congress, usually the spending bills that pass are with the minority's with enough of the majority party members to pass). Or big new programs. And the president has the bully pulpit. The president also starts the wars these days. I just don't buy the notion that spending reflects the priorities of the party in control of the House (regardless of the party of the president), not since I've been observing politics.
Show me a Congress where the programs and spending priorities reflected a wish-list of the majority party in the House (or Congress) when the president was of the other party.
Actually, usually, when the president and Congress are of different parties, there aren't any new spending initiatives, more like just a continuation of the previous year's spending +/-. In other words, kind of a stalemate, with spending roughly on autopilot.

Dreamer Tatum
(10,926 posts)
Octafish
(55,745 posts)Government by Red Ink has gotten us what, besides wars without end and rich people allergic to taxes?
* Thanks to the great DUer leveymg: http://www.democraticunderground.com/discuss/duboard.php?az=view_all&address=389x2943799