Video & Multimedia
Related: About this forumNASA Releases Stunning New Images Of Jupiter From James Webb Space Telescope - The 11th Hour - MSNBC
NASA releases stunning new images of Jupiter from the James Webb Space Telescope and a haunting audio clip taken from a black hole. - Aired on 08/24/2022.
 = new reply since forum marked as read
Highlight:
NoneDon't highlight anything
5 newestHighlight 5 most recent replies
= new reply since forum marked as read
Highlight:
NoneDon't highlight anything
5 newestHighlight 5 most recent replies

tblue37
(65,477 posts)Fritz Walter
(4,291 posts)The images were jaw-dropping enough.
But then the audio from the black hole was even more impressive.

Thanks!

Duppers
(28,125 posts)TY, Miss R. 

MiHale
(9,767 posts)The excitement was off the charts then as well. Those pictures were unbelievable…we never saw anything like that before. And now “interviewing” a black hole…no words.

Rhiannon12866
(205,839 posts)And exploring what's out there. I can remember in elementary school, they'd bring a TV into the classroom so we could watch those early space launches. The excitement back then was palpable - and with the technology that we have now we can learn more than we imagined before. 
littlemissmartypants
(22,725 posts)VWolf
(3,944 posts)Sure, sound can travel through the gaseous media surrounding a black hole, but how is it detected here, 240 light years away? There is plenty of vacuum between here and there.
xocetaceans
(3,871 posts)please see the following, if interested:
Chandra "Hears" a Supermassive Black Hole in Perseus
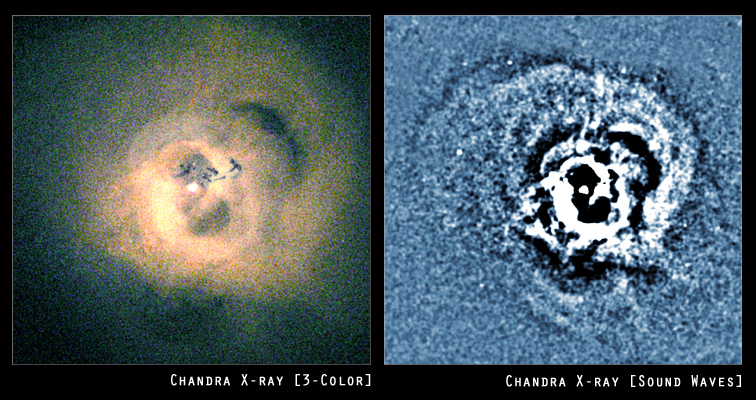
Perseus Cluster
Credit: NASA/CXC/IoA/A.Fabian et al.
A 53-hour Chandra observation of the central region of the Perseus galaxy cluster (left) has revealed wavelike features (right) that appear to be sound waves. The features were discovered by using a special image-processing technique to bring out subtle changes in brightness.
These sound waves are thought to have been produced by explosive events occurring around a supermassive black hole (bright white spot) in Perseus A, the huge galaxy at the center of the cluster. The pitch of the sound waves translates into the note of B flat, 57 octaves below middle-C. This frequency is over a million billion times deeper than the limits of human hearing, so the sound is much too deep to be heard.
The image also shows two vast, bubble-shaped cavities, each about 50 thousand light years wide, extending away from the central supermassive black hole. These cavities, which are bright sources of radio waves, are not really empty, but filled with high-energy particles and magnetic fields. They push the hot X-ray emitting gas aside, creating sound waves that sweep across hundreds of thousands of light years.
The detection of intergalactic sound waves may solve the long-standing mystery of why the hot gas in the central regions of the Perseus cluster has not cooled over the past ten billion years to form trillions of stars. As sounds waves move through gas, they are eventually absorbed and their energy is converted to heat. In this way, the sound waves from the supermassive black hole in Perseus A could keep the cluster gas hot.
...
https://chandra.harvard.edu/photo/2003/perseus/index.html
Note in the above that: "The features were discovered by using a special image-processing technique to bring out subtle changes in brightness."
So, the region around Perseus was observed by an x-ray telescope and image processing was used to detect changes in density of the medium.
Here is the paper that describes those observations:
A. C. Fabian, J. S. Sanders, S. W. Allen, C. S. Crawford, K. Iwasawa, R. M. Johnstone, R. W. Schmidt, G. B. Taylor
Monthly Notices of the Royal Astronomical Society, Volume 344, Issue 3, September 2003, Pages L43–L47,
https://doi.org/10.1046/j.1365-8711.2003.06902.x
Published: 21 September 2003
Abstract
We present preliminary results from a deep observation lasting almost 200 ks of the centre of the Perseus cluster of galaxies around NGC 1275. The X-ray surface brightness of the intracluster gas beyond the inner 20 kpc, which contains the inner radio bubbles, is very smooth apart from some low-amplitude quasi-periodic ripples. A clear density jump at a radius of 24 kpc to the north-east, about 10 kpc out from the bubble rim, appears to be due to a weak shock driven by the northern radio bubble. A similar front may exist around both inner bubbles but is masked elsewhere by rim emission from bright cooler gas. The continuous blowing of bubbles by the central radio source, leading to the propagation of weak shocks and viscously dissipating sound waves seen as the observed fronts and ripples, gives a rate of working which balances the radiative cooling within the inner 50 kpc of the cluster core.
1 Introduction
The Perseus cluster, A426, is the X-ray-brightest cluster of galaxies in the sky. The giant central galaxy, NGC 1275, hosts the radio source 3C 84 (Pedlar et al. 1990), from which jets have blown two diametrically opposed bubbles in the hot intracluster medium (Böhringer et al. 1993; Fabian et al. 2000). Surrounding NGC 1275 is a spectacular Hα nebulosity with filaments extending over 100 kpc (Lynds 1970; Conselice, Gallagher & Wyse 2001).
The radiative cooling time of the hot gas drops inward to ∼108 yr around NGC 1275, and the temperature drops down from ∼7 to about 3 keV. As has been found for many clusters with Chandra and XMM-Newton data (Peterson et al. 2001, 2003; Tamura et al. 2001), there is little gas at lower temperatures. A standard cooling flow (Fabian 1994) is not taking place despite the short cooling times, presumably because of some balancing heat source. Plausible heat sources are an active galactic nucleus (Tucker & Rosner 1983; Tabor & Binney 1993; Churazov et al. 2000; Böhringer et al. 2002) and the hot atmosphere surrounding the active galactic nucleus (AGN) (Bertschinger & Meiksin 1986; Narayan & Medvedev 2001). The jets and bubbles may heat the surrounding gas from the centre (Brüggen & Kaiser 2001; Quilis, Bower & Balogh 2001; Reynolds, Heinz & Begelman 2001; Basson & Alexander 2003) or thermal conduction may heat it from the outside (Voigt et al. 2002; Fabian, Voigt & Morris 2002c; Zakamska & Narayan 2003). Combinations of heating and conduction have also been proposed (Ruszkowski & Begelman 2002). It has proven difficult in many models to match the observed temperature profiles (Brighenti & Mathews 2003). Other possibilities involving inhomogeneous metallicity (Fabian et al. 2001; Morris & Fabian 2003) and mixing with cooler gas (Fabian et al. 2001, 2002b) remain.
We observed the core of the Perseus cluster with Chandra for about 25 ks in 2001 (Fabian et al. 2000; Schmidt, Fabian & Sanders 2002). Here we report on a recent Chandra observation which was almost 10 times deeper (∼200 ks). The complex two-dimensional temperature distribution of the hot gas is now clear, and subtle structures are revealed. These may be dissipating sound waves caused by the bubbles. The power from the sound waves is consistent with the radiative losses of the cluster core.
...
https://doi.org/10.1046/j.1365-8711.2003.06902.x
The PDF of the paper is available at that link.
Here is a description of the x-ray telescope and its platform, the Chandra X-ray Observatory:
Since its launch on July 23, 1999, the Chandra X-ray Observatory has been NASA's flagship mission for X-ray astronomy, taking its place in the fleet of "Great Observatories."

Chandra Spacecraft Components
Who we are
NASA's Chandra X-ray Observatory is a telescope specially designed to detect X-ray emission from very hot regions of the Universe such as exploded stars, clusters of galaxies, and matter around black holes. Because X-rays are absorbed by Earth's atmosphere, Chandra must orbit above it, up to an altitude of 139,000 km (86,500 mi) in space. The Smithsonian's Astrophysical Observatory in Cambridge, MA, hosts the Chandra X-ray Center which operates the satellite, processes the data, and distributes it to scientists around the world for analysis. The Center maintains an extensive public web site about the science results and an education program.
What we do
Chandra carries four very sensitive mirrors nested inside each other. The energetic X-rays strike the insides of the hollow shells and are focussed onto electronic detectors at the end of the 9.2- m (30-ft.) optical bench. Depending on which detector is used, very detailed images or spectra of the cosmic source can be made and analyzed.
...
https://chandra.harvard.edu/about/
I hope that you have a chance to take a look at this entire reply, but its essential summary is at the top in case this is too expansive a reply.
So, the sound waves are reconstructed from the data, as if the observer was within the cloud of gases.
I'm quite familiar with the Chandra Observatory. It's quite a marvel of engineering, as are Hubble, JWST, etc.
Thanks for the info.
xocetaceans
(3,871 posts)...of how they observed "ripples". Of course, the scale of all of this makes the "wavelengths" very long - hence the low inferred frequencies.
The data is (or are - depending on one's view of datum/data) from Section 3 below:
- "11 kpc" (kiloparsec) is equal to about 3.4 x 10^17 km or 3.6 x 10^4 light years - (I used Google's unit converter on this and have not checked the result independently.) A wavelength of 36,000 light years is significant.
- Also, "9.6 × 10^6 yr" is a period of about ten million years.
So, "sound" with its usual connotations might be a bit of a stretch. How long would a creature's lifespan need to be to experience personally such an "auditory sensation", as it were? [This does not even ask how sensitive the creature's ears would need to be to detect the relevant fluctuations in density. And that is not even to mention that the creature would have to exist exposed to a quite hostile environment.]
Anyway, that's all just fun speculation. The analogy is useful to create interest and spark imagination even though it takes a telescope and a distant perspective to see the phenomenon's occurrence.
A. C. Fabian, J. S. Sanders, S. W. Allen, C. S. Crawford, K. Iwasawa, R. M. Johnstone, R. W. Schmidt, G. B. Taylor
Monthly Notices of the Royal Astronomical Society, Volume 344, Issue 3, September 2003, Pages L43–L47,
https://doi.org/10.1046/j.1365-8711.2003.06902.x
Published: 21 September 2003
...
2 Analysis
...
[see Figure 3]
To reveal the larger scale structure in the cluster we used unsharp masking. A 0.3–7 keV exposure-map-corrected image was smoothed with Gaussians of fixed width 0.98 and 9.8 arcsec; the two smoothed images were then subtracted, the result of which is shown in Fig. 3. Areas in which there was a deficit of counts relative to the larger scale are shown as black, and areas that showed a surplus are shaded white. It can be seen that there are a number of ripple-like structures which lie outside the outer radio lobes. We have investigated a range of smoothing lengths; the smaller one must be less than a few arcsec and the larger one about half a ripple wavelength. When their location is known, the ripples can be discerned by eye in the original raw image. The implication of the ripples is discussed in a later section.
...
3 Discussion
...
The ripples seen in the unsharp-masked image (Fig. 3) are intriguing. They appear to be quasi-spherical. A prominent inner one to the north-east, immediately outside the northern bubble, has a sharpish edge. The surface brightness drops by about 20–30 per cent at its edge (Fig. 4). No obvious temperature or abundance changes occur at this point, so it is best explained as a density and pressure change.
...
If the ripples are pressure (sound) waves moving at constant speed (about 1170 km s−1 for a temperature of 5 keV) then their separation (wavelength) of about 11 kpc means a period of about 9.6 × 10^6 yr.
...
https://doi.org/10.1046/j.1365-8711.2003.06902.x
VWolf
(3,944 posts)cochlea

xocetaceans
(3,871 posts)Hang in there!