Environment & Energy
Related: About this forumUpdated: 80% of world CO2 emissions are related to population levels.
Last edited Thu Oct 4, 2012, 11:54 AM - Edit history (3)
This is an OP from my comment here.
I've been wondering how much of the trouble we're in is due to population per se, and how much is due to our consumption. I've waffled back and forth on the issue. I decided to see if I could quantify the proportions of CO2 that are attributable to population and consumption.
This afternoon I developed a rough-and ready approach using normalized CO2 emission, population and "consumption" figures (more on the data later) from 1970 to 2009. Here are the steps in the analysis:
- I normalized all data series (CO2, Population and "consumption" to be 1.0 in 1985.
- In the following equation, nCO2 means normalized CO2, nPop is normalized population, and nCons is normalized consumption.
- I assumed that nCO2 = xnPop + (1-x)nCons. What this means is that the proportion of CO2 associated with population growth (xnP) plus the remaining CO2 from consumption ((1-x)nCons) add up to all the CO2 we emit. I warned you it was "rough and ready"...
- I calculated the expected amount of CO2 to be produced each year (1970 to 2009) while varying x from 0 to 1.0.
- I found the difference between the actual and expected values of CO2, and converted that difference to a percentage of the actual value.
- I graphed the percentage values.
- I varied the value of x over its range until I visually found the value that minimized the excursions of the percentage variance graph.
- The value of x at which the excursions were the least was deemed to be the proportion of CO2 attributable to population growth.
For "consumption" proxies I used two data sets. One was global GDP in constant 1990 Geary-Khamis dollars, from Maddison. The other was the sum of the tonnes of steel and cement produced world-wide, from the USGS. I tried the latter in order to minimize the influence of the non-productive portions of GDP.
The results in both cases were broadly similar - excursions were minimized with x=0.85, meaning that over the period 1970 to 2009 about 85% of our CO2 emissions were attributable to population levels, with only 15% attributable to consumption.
The GDP plot was noisier than the steel+cement plot, as you would expect, but the overall behaviour was the same. Using the steel+cement data set, the maximum excursions were +4%/-6%. Given the level of approximation involved with this analysis and the inherent variability of human numbers and activity, that seems like acceptable accuracy.
I'm fairly confident now in saying that we would be much better served by attacking climate change through population reduction rather than consumption reduction. How that might be accomplished is, as always, a very open and controversial question.
If people want to see my work, I'll put up a web page on it.
 = new reply since forum marked as read
Highlight:
NoneDon't highlight anything
5 newestHighlight 5 most recent replies
= new reply since forum marked as read
Highlight:
NoneDon't highlight anything
5 newestHighlight 5 most recent replies
RobertEarl
(13,685 posts)" How that (population reduction) might be accomplished is, as always, a very open and controversial question. "
Die. And not have babies. In 100 years, there would be no human population.
The real question is: Who is gonna die first?
The answer to that is .....the ones most susceptible to unnatural radiation which comes from our nuke fires which can not be extinguished.

wtmusic
(39,166 posts)What's that?
RobertEarl
(13,685 posts)... can be considered to be unnatural. Right?
wtmusic
(39,166 posts)Or is that unnatural? 
RobertEarl
(13,685 posts)Stand in the sunshine just about anywhere for a week and see how you feel.
Then stand at the gates of hell of Fukushima for a week and I think, just maybe, you'll know the difference.
wtmusic
(39,166 posts)30,000, in the US alone, have died from "natural" radon-induced lung cancer.
"Predicted future cancer deaths due to accumulated radiation exposures in the population living near Fukushima have ranged from none[26] to 100[27] to a non-peer-reviewed "guesstimate"[28] of 1,000.[20]"
http://en.wikipedia.org/wiki/Fukushima_Daiichi_nuclear_disaster
1,000 deaths. TOTAL.
Now...which kind of radiation is more dangerous, "natural" or "unnatural"?
RobertEarl
(13,685 posts)It has only been a few months since the fires at Fukushima went out of control. And the fires are still burning. And, like the radiation from sunshine, the 'F' radiation has traveled and will continue to spread over the earth.
Radiation levels across the N. hemisphere are higher now than before Chernobyl and Fukushima. Particles of the heavy metals from both places are now scattered from Japan around the globe to China. And there they sit with half-lives of sometimes 30-200 years.
Surely you are not suggesting that radiation from nuke explosions is as safe as sunshine, are you?
wtmusic
(39,166 posts)No wonder you're concerned - you have a very poor understanding of radiation and what happened in Japan.
1) The fires at Fukushima have been controlled for a year and a half (no fires are still burning).
2) There is no such thing as 'F' radiation.
3) There is not statistically-relevant increase in global radiation, at the present time, from either Chernobyl or Fukushima.
4) There was never a "nuke explosion" (nuclear chain reaction, like in a bomb) at Fukushima.
Here's some perspective: barely three weeks after the disaster, radiation levels were only slightly higher in Tokyo than they were in New York City:
"Many countries have naturally occurring radiation levels that exceed Tokyo’s, said Bob Bury, former clinical lead for the U.K.’s Royal College of Radiologists. A 30-fold surge in such contamination in Tokyo prompted thousands of expatriates to leave Japan after the March 11 tsunami knocked out power at Tokyo Electric Power Co.’s Fukushima Dai-Ichi nuclear plant, triggering the crisis. Radiation in Tokyo is barely above levels in London and New York even now, analysts said.
“The situation in Japan looks set to follow the pattern of Chernobyl, where fear of radiation did far more damage than the radiation itself,” Bury said in an e-mail referring to the 1986 accident in the former Soviet Union, the world’s worst nuclear disaster. “Whatever the radiation in Tokyo at the moment, you can be fairly sure it is lower than natural background levels in many parts of the world.”
Exceeds New York
Tokyo’s radiation level is only slightly higher than New York, where an average of 0.095 microsieverts an hour was recorded in the seven days to yesterday, according to a real- time Geiger counter reading set up as part of the Background Radiation Survey, a project where owners of the equipment feed their readings into a central database. The level in Tokyo the day before the accident averaged 0.0338 microsieverts an hour."
http://onhudson.typepad.com/onhudsoncom/2011/04/radiation-levels-in-cities-around-the-world-exceed-tokyo-today-is-that-a-comforting-thing-.html
Particles of the heavy metals from both places are now scattered from Japan around the globe to China. And there they sit with half-lives of sometimes 30-200 years.
Particles of radioactive materials are scattered around the globe, and some have half-lives much longer than 200 years (plutonium's is 80 million years). Even still, from a statistical standpoint, you're about 2 million times more likely to die from starvation than radiation from Fukushima.
Knowledge will set you free. Media hysteria peddled by idiots like Arnie Gundersen won't.
So you DO believe sunshine is more dangerous than radiation from nukes?
Then you claim:
1) The fires at Fukushima have been controlled for a year and a half (no fires are still burning).
Where is the corium? Last we heard it had burned through the metal and then the concrete. Three buildings are too dangerous for humans and are venting core radiation to the atmosphere. The fires are still burning.
2) There is no such thing as 'F' radiation.
You really didn't even think about this, did you? "F" was just an abbreviation for Fukushima. And it went right over your head? What else goes right over your head? A lot, it appears.
3) There is not statistically-relevant increase in global radiation, at the present time, from either Chernobyl or Fukushima.
There are lies, damn lies and statistics. What's a great lie about your 'statistics' is that these are one-of-a-kind events and the effects of this radiation, besides being hidden by governments, is something that could well continue and cause problems for as you claim -- 80 million years. IOW, the science has not yet determined what the effects will be. Yet here you are making determinations. That is damned foolish, and you know it.
4) There was never a "nuke explosion" (nuclear chain reaction, like in a bomb) at Fukushima.
There are, in nuclear power plants, creating heat, nuclear chain reactions taking place. In a functional reactor the reactions are controlled. When a reactor gets out of control, it blows sky-high. Well, the videos show two reactor buildings blowing sky-high.
And again, you are, before all the science is in, coming to a conclusion that the chain reactions ended as designed. Well, smart people know that until we can examine the core materials, no real conclusions can, nor should, be made. Yet here you are making conclusions!!
In closing all one can determine about your arguments is that you don't know much about what you are claiming. Oh, and about Arnie, he has been proven correct again and again. You, not so much. Now lets see, who should I trust.... Arnie, or some internet poster who can't even figure out what "F" stands for?
wtmusic
(39,166 posts)Sunshine kills more people every year than Fukushima has killed, or will ever kill. These are the facts, my friend, and bold type and exclamation points do nothing to change that.
Your attempt to put radiation from Fukushima in its own class ('F' radiation) is nonsense. It's exactly the same kind of radiation as in the soil you walk upon and the food you eat every day.
The two reactor buildings blew "sky-high" because of a hydrogen explosion - a chemical reaction. Hydrogen was created when the cladding of the fuel rods in the reactor melted and reacted with water. Though hydrogen explosions can be powerful, this has nothing to do with a nuclear chain reaction:
As to your claim that "The science has not yet determined what the effects will be" of radiation, there is actually a great deal of science on what the long term effects are. The effects from Fukushima are, and will be, statistically insignificant.
Now - I've provided links to back up my point of view. If you want to continue this discussion you can provide some of your own, and the thoroughly discredited and debunked crap from Fairewinds won't cut it.
RobertEarl
(13,685 posts)"Nothing man does can change the climate" The CCD's say.
This statement is correct: "...there is actually a great deal of science on what the long term effects (of radiation) are"
The science says that radiation kills. It causes gene mutations. It causes cancer. We are existing now in an environment with radiation that is beyond natural. It is cumulative. It is long lasting. It is global. It may even be contributing to climate change.
Now, not only do we have the co2 + radiation from sunshine causing climate change, we now have an atmosphere with decaying Xenon products and who knows what else.
Like the CCD's 'science' that says we haven't caused problems, the pro-nukes deny the established science detailing effects of unnatural radiation.

Iterate
(3,021 posts)I looked at doing something like this a while back and spent just enough time at it to uncover the minefields of pitfalls (as well as a few mixed-metaphors). You've certainly seen some of them this evening as well.
I'll withhold judgement until I have more time and can see more. I should say though that my bias going into the project is radically anti-consumption.
GliderGuider
(21,088 posts)It's bone-simple to use. Just look for the numbers in bold in Column B, rows 17 and 41, and twiddle them.
If you want to put in your own proxy data for consumption, it's also easy. Substitute your own annual data for the numbers in either row 7 or row 8.
The big question is whether you agree with my assumption of nCO2=xnPop+ynCons.
http://www.paulchefurka.ca/CO2_Pop_Consumption.xlsx
GliderGuider
(21,088 posts)I said above that CO2 levels are "attributable to" population levels very deliberately, in order to hand-wave past the details to get to the basic point: "It's the people, stupid!".
My methodology assumes that at this moment in time there is a certain irreducible set of GHG-producing activities that go along with being alive. It's sort of a birthright, our individual share of the common human life-support system - a system that has to expand by a set amount each time an Average Human™ is born. Some of that irreducible set of activities includes eating (which implicates the 20% or so of the world's fossil fuels that support the Food System™), housing to the standard a "world average" person with a $10,000 annual income can afford, some transportation, some clothing and a modicum of life-supporting Stuff™. Individuals are born into different circumstances, of course, but over the course of a year the 75 million new individual circumstances are blenderized to an average - at least as far as CO2 production is concerned. When I say "80% of CO2 production is attributable to population" this is what I'm talking about. The raw population number is being used as a proxy for all the implied activity that is required to sustain an average human life in the late 20th/early 21st century.
Then there's the other stuff - industrial production that isn't distributed evenly across the world's population. You might think of it as "System Support Consumption". That might include Manhattan skyscrapers, military equipment, airliners etc. The numbers associated with these activities would show far less correlation to global population numbers, but they definitely contribute to greenhouse gasses. This is what I tried to model by using global steel and cement production.
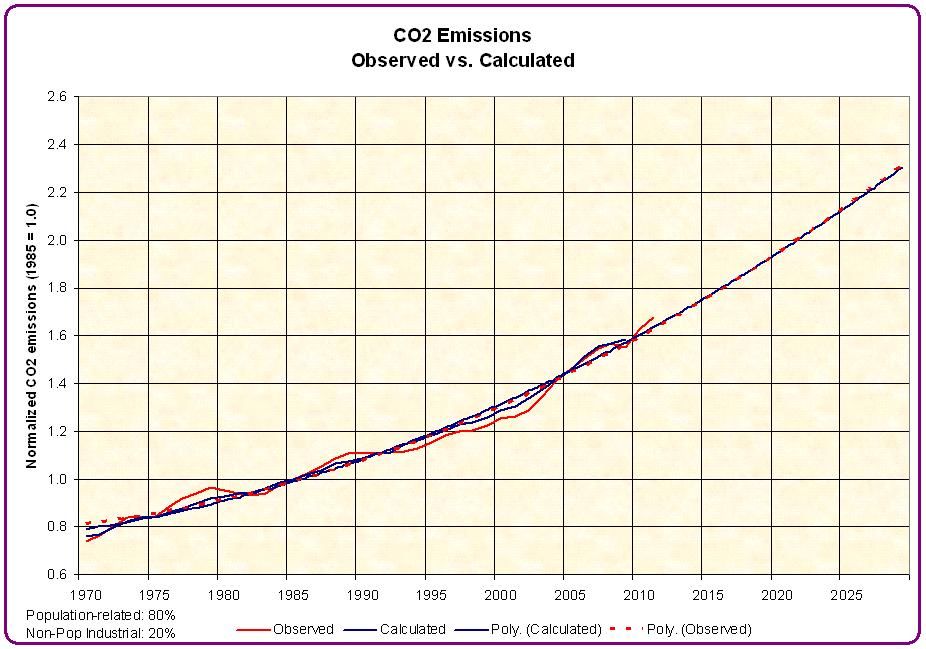
So, what I found is that 80% of the CO2 is being produced by activities that are very broadly (even universally) distributed across the population while the last 20% isn't. This means that CO2 levels will track population numbers quite closely as long as the current situation holds. In order to preserve out population numbers while still reducing our CO2 emissions significantly, we would have to significantly break the stranglehold that fossil fuels have on our daily lives, and we would have to do it in a global manner. I don't think this is in the cards, at least not for a Global Empire™ of 7 billion people, all of whom have firm expectations for the future based on an historical energy anomaly - cheap, abundant fossil fuels.
The graph below - which includes projections out to 2030 - shows how close the calculated combination comes to matching our observed emissions. It uses the same steel&cement numbers, normalized for the difference in the amount of CO2 a tonne of each material generates. The fact that the two trend lines are identical over a 60 year span is the best indication I've found yet that the methodology is sound.

muriel_volestrangler
(107,010 posts)CO2 emission ratio 2009/1970 = 1.55/0.74 = 2.09
Population: 1.39/0.76 = 1.71
GWP: 2.23/0.58 = 3.84
0.85*1.71 + 0.15*3.84 = 2.03
But this doesn't mean "we would be much better served by attacking climate change through population reduction rather than consumption reduction". What you've showed is that each value has grown, on average, at different rates. The CO2 rate being close to the population rate is not an indication it is mainly caused by the population rate. If I found another amount that had grown about 2.1 times from 1970 to 2009, then your method would say "it's all due to this new amount, and nothing to do with either population or GWP/steel&cement".
Population reduction can only happen gradually (without actually killing people, that is). But material 'consumption' is neither Gross World Product, nor steel/cement consumption. What the difference in growth of GWP/steel & cement use and CO2 emissions shows is that we have managed to produce less CO2 per GWP than we used to. We have become more efficient - through more efficient vehicles or generators, use of renewable energy, use of gas rather than coal, better insulation, more efficient electrical devices, and so on. To say "it should be about population reduction rather than consumption reduction" is to ignore the success we'd had so far, and to pretend that our alternatives are only "cut the population" or "make us poorer, on average". We don't have to cut CO2 emissions by purely cutting economic activity; we can look for more efficiencies, from a CO2 producing point of view.
GliderGuider
(21,088 posts)After all, money doesn't emit CO2. Producing steel and concrete, however...
You may disagree with my analysis, but it's just another effort to find some way to drive home this basic argument:
- Our civilization and all our individual lives depend on fossil fuels for survival at this time, whether directly or indirectly.
- The more people there are, and the bigger and more active civilization becomes, the more CO2 is released by our increasing consumption of fossil fuels.
- CO2 is now impacting the planet through weather changes - changes that are fairly mild right now, but will accelerate.
- The only way to slow this acceleration (we are past the point of being able to halt the temperature rise) is to reduce our CO2 emissions.
- The only way to reduce CO2 emissions enough to matter while maintaining population levels is through a massive, global shift away from fossil fuels.
- There is no sign that we are preparing, or prepared, to reduce our fossil fuel use.
- The only other way to reduce emissions is through population reduction.
- There is no sign that we are prepared to reduce our population growth below its 50 year plateau of 75 million per year.
- That means that CO2 emissions will not be reduced unless Things Fall Apart.
- If things do not fall apart, fossil fuel use and temperature will continue to climb until things do fall apart.
- When things do fall apart people will die, population will be reduced, fossil fuel use will fall, and global warming will eventually decelerate.
The human race is in a box. Even if some of us want to reduce fossil fuel use - whether through substitution, activity reduction or not reproducing - there are too may who don't feel like doing that, and it's too late to avoid the impact in any event. For those few of us who do want to make changes, the degree of deceleration that we can manage is minuscule compared to the forces already unleashed on the planet. This situation may (will) change after Things Fall Apart.
Even in the face of this awful prospect, however, we are still left with the perennial advice of the sages: "In all matters, strive to do the right thing."
SESKATOW
(99 posts)GliderGuider
(21,088 posts)To a first approximation, it might look like the problem, but the roots of our predicament dive far deeper than mere capitalism - back into our dim and distant past, deep into our neural wiring, and down in to our DNA.
IOW, "We are the problem, not the solution..."
Welcome to DU! 
SESKATOW
(99 posts)it's not the people of Nepal or Somalia that have cause this. Cuba's CO2 emissions are 2.4 tonne per capita vs Qatar 44. This indeed is a consequence of the perpetual growth model. We know we are about to drive off a cliff, yet we continue with BAU. Insanity?
NoOneMan
(4,795 posts)In a social democracy (what the US is basically) is the goal to make people breed less and consume less? No, but rather, the focus is simply how the wealth generated via production is distributed (labor is rewarded over capital).
Socialism is a gentler, friendly car than capitalism. Both are headed over the cliff at different speeds.
The problem isn't about the political and philosophical institutions that civilization creates, but rather civilization itself, which is bent on mindless and infinite growth.
Iterate
(3,021 posts)There are just too many variables embedded in that index, and too many non-consumptive ones to make it useful.
I think I'll have to disagree on most of the rest of it though. That seems a crazy tall order given how convincing your graph looks and how close the correlation is. It's almost too close. There's something wrong in this and I admit I don't have a full grasp of what it is. I suspect that the steel/cement variance substituted well enough for for both GWP and average CO2 per capita that it was a reasonable match to the observed CO2. I haven't plotted an alternative, but could if you want. Mainly I'd just point out that if you apply this to individual economic blocks it falls apart.
Here's a tidbit. We know about Bangladeshi population growth in the past decades.
Even under-developed West Bengal of India consumes cement one and a half times higher than Bangladesh does.
“Per capita cement consumption in Bangladesh is less than 100 kilograms (kg), which is 150kg in West Bengal and more than 1,000kg in China,” said Mike Cowell, managing director of Lafarge Surma Cement, Bangladesh.
Cowell was talking to The Daily Star recently at his office in Gulshan. He has been heading the cement company in Bangladesh for the past five years.
www.thedailystar.net/newDesign/news-details.php?nid=234830
I didn't re-graph anything, but just quickly normalized on 1970 and checked the correlations of the variance pairs. They're all very high, higher than that of GWP and Steel+cement at .89. I didn't see how assigning a higher proportion of the value to population helped the overall accuracy.
Observations:
First of all, there's so much carbon embedded in the steel/cement proxy that it can stand in for the measured CO2 as well as the GWP. If consumption falls off the radar, either by substitution or efficiency, it doesn't get counted. Steel and cement are sensitive to development, not population. As demand gets largely satisfied in one developed market, production has moved elsewhere.
Second, the use of 'total population' might be good for giving an overall direction and fate, but it masks the bigger and more subtle story. In a sense there is no such 'thing' as population, it's just a construct that embeds a swarm of variables. It matters less to CO2 totals if you are born than it does where you are born and to which class you are born. Born in the USA means 20x the carbon of an average African, and born 1% might be 20x more.
Plus, the CO2 burden that comes with your birth doesn't get paid right away. First there are eighteen years or so of social cost before the CO2 payment of transportation, work, and setting up a household begins. Non-traveling, book-reading retirees are likely past their CO2 peak. So, in essence, a young country is one with a CO2 emitting future.
And that brings up another point. After looking through this for a day, I'm reminded just how deterministic the type of energy and consumption culture one is born to can be. I don't think that it's because of virtue that Europeans consume half as much as the US for the same life quality, but more a matter of the consumption culture, economic assumptions, infrastructure, and leadership. The bad news is that those things are nearly as resistant to change as is our DNA.
Off topic, but interesting. The European population levels stayed nearly constant from from about from the 4th to the 10th centuries, largely in part to slave raiding from the north and south. It was begun by the Romans, who didn't allow slaves to breed, worked them to death, then raided for more. That 'economic' pattern continued for six centuries after the Romans were gone. Those patterns die hard.
OK, now that I've worked myself into some dark thoughts, some tables I noticed. These slopes don't match population increase:
from: http://petrolog.typepad.com/climate_change/2010/01/cumulative-emissions-of-co2.html
Annual Emissions of Carbon Dioxide from the Combustion of
Fossil Fuels and Production of Cement by Region: 1850-2006
Source of data: Carbon Dioxide Information Analysis Center, sited above.

Cumulative Emissions of Carbon Dioxide and Percentage by Region: 1850-2006
Source of data: Carbon Dioxide Information Analysis Center, sited above.

And damn, somewhere here I had a tidy chart of Chinese steel production since 2000 that explained a post-2004 hook in your data. Now lost to the clutter, forever.
So I'll substitute with this. It's only for the EU and it's only one year, but it doesn't seem to correlate to population change, but it does to development.
http://setis.ec.europa.eu/newsroom-items-folder/per-capita-cement-consumption-in-selected-countries/image_large
Some sources of the week:
Analysis of the Relationship between Growth in Carbon Dioxide Emissions and. Growth in Income.
www.econ.cam.ac.uk/rstaff/grubb/publications/GA12.pdf
Economic Growth and CO2 Emissions: a Nonparametric Approach
webdoc.sub.gwdg.de/ebook/serien/e/CORE/dp2001-12.pdf
Population Is a Critical Factor for Global Carbon Dioxide Increase
jhs.pharm.or.jp/data/55(1)/55_125.pdf
Overpopulation and Climate Change
http://www.biologicaldiversity.org/campaigns/overpopulation/climate/index.html
Global and regional drivers of accelerating CO2 emissions
http://www.pnas.org/content/104/24/10288.abstract
One approach I'd like to look at is extrapolation of 1950-1960 data on consumption v. population to see where that leads. Another would be to use miles driven per capita as a consumption proxy v. CO2 v. population, since it might reflect changes in efficiency, or it might just be interesting for uncovering something. I'm not finding good data for those though.
Afterthought:
Thanks for doing this, though I have to admit that after having gone through it, between the recalcitrance of my fellow Americans and insight into development plans for some highly populated countries, I'm firmly more pessimistic than anyone else on the board.