Environment & Energy
Related: About this forumNSIDC - Despite Rapid Regrowth, Arctic Sea Ice Still Far Below Previous Record Low For November
Mods: Press Release
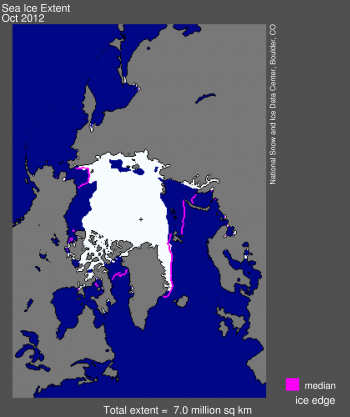
Figure 1. Arctic sea ice extent for October 2012 was 7.0 million square kilometers (2.7 million square miles). The magenta line shows the 1979 to 2000 median extent for that month. The black cross indicates the geographic North Pole. Sea Ice Index data. About the data
Arctic rapidly gaining winter ice
November 5, 2012
Ice extent doubled in October. The rate of increase since the 2012 minimum was near record, resulting in an October monthly extent 230,000 square kilometers (88,800 square miles) greater than the previous low for the month, which occurred in 2007. Despite this rapid growth, ice extent remains far below normal as we begin November.
Overview of conditions
Average ice extent for October was 7.00 million square kilometers (2.70 million square miles). This is the second lowest in the satellite record, 230,000 square kilometers (88,800 square miles) above the 2007 record for the month. However, it is 2.29 million square kilometers (884,000 square miles) below the 1979 to 2000 average. The East Siberian, Chukchi, and Laptev seas have substantially frozen up. Large areas of the southern Beaufort, Barents and Kara seas remain ice free.
As of November 4, sea ice extent stood at 8.22 million square kilometers (3.17 million square miles). This is 520,000 square kilometers (201,000 square miles) below the extent observed in 2007 on the same date, and ice extent remains 2.04 million square kilometers (788,000 million square miles) below the 1979 to 2000 average for this date.
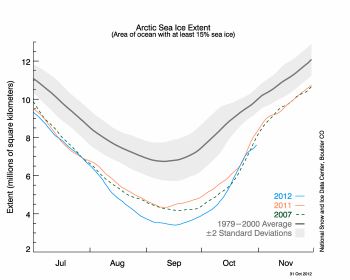
Figure 2. The graph above shows Arctic sea ice extent as of October 31, 2012, along with daily ice extent data for 2011 and for the previous record year, 2007. 2012 is in blue, 2011 is orange, and 2007 is shown in green. The gray area around the average line shows the two standard deviation range of the data. Sea Ice Index data.
Conditions In Context
After the record minimum ice extent on September 16 and through October 31, the Arctic gained 4.19 million square kilometers (1.62 million square miles) of ice. Ice extent doubled during the month of October. The average rate of ice growth for October was 121,000 square kilometers (46,700 square miles) per day, causing the extent to temporarily climb above the extent observed during October 2007 for a period. This led to a monthly average extent slightly above levels in 2007, the previous record low October. Slower ice growth during the last few days of the month then brought extent below 2007 levels.
On October 20, ice extent went above 6.0 million square kilometers (2.3 million square miles) for the first time since August 6.

Figure 3. Monthly October ice extent for 1979 to 2012 shows a decline of -7.1% per decade.
October 2012 Compared To Previous Years
Due to the rapid ice growth during October, Arctic sea ice extent for October 2012 was the second lowest in the satellite record, above 2007. Through 2012, the linear rate of decline for October Arctic ice extent over the satellite record is -7.1% per decade.
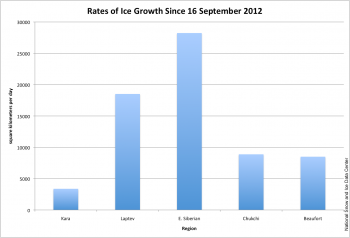
Figure 4. This graph shows rates of ice growth in the Arctic since the September 16, 2012 minimum extent and through October 31. Growth has been particularly rapid in the East Siberian and Laptev seas.
Asymmetric Ice Growth & Temperatures
While overall the Arctic rapidly gained ice throughout October, the rate of ice growth was not the same everywhere. Ice growth in the Beaufort and Chukchi seas averaged about 8,500 square kilometers (3,300 square miles) per day and large areas still remain ice free. In the eastern Arctic there was rapid ice growth in the East Siberian and Laptev seas exceeding, respectively, 28,000 and 18,000 square kilometers per day (11,000 and 7,000 square miles per day). As a result, most of the region is now completely frozen over. The slowest rates of ice growth have occurred in the Kara Sea (less than 3,000 square kilometers, or 1,000 square miles per day). In large part because of extensive open water in the Kara and Barents seas, air temperatures for October in this area at the 925 hPa level (about 3,000 feet above the surface) were 3 to 4 degrees Celsius (5 to 7 degrees Fahrenheit) above average, with unusual warmth becoming more pronounced near the surface. October air temperatures over the ice-free southern Beaufort Sea were also far above average.
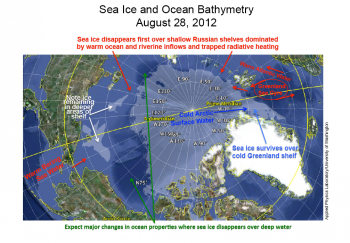
Figure 5. This image provides a snapshot of how ocean depth in the Arctic influences sea ice extent. Sea ice cover for August 28, 2012 is shown in semi-transparent white; ocean depths are indicated in blues, with deeper blues indicating greater depth. Sea ice data are from the Multisensor Analyzed Sea Ice Extent (MASIE), which provides more accurate ice edge position.
Ice Extent & Bathymetry - The Floor's The Limit
Research by our colleagues Jamie Morison at the University of Washington Seattle and NASA scientist Son Nghiem suggests that bathymetry (sea floor topography) plays an important role in Arctic sea ice formation and extent by controlling the distribution and mixing of warm and cold waters. At its seasonal minimum extent, the ice edge mainly corresponds to the deep-water/shallow-water boundary (approximately 500-meter depth), suggesting that the ocean floor exerts a dominant control on the ice edge position. However, in some cases, ice survives in the shallower continental shelf regions due to water circulation patterns. For example, the shelf area of the East Greenland Sea is almost always covered with sea ice because the southward-flowing cold Arctic surface water helps to limit melt.
In contrast, ice disappears in shallow areas like the Barents and Chukchi seas that are subject to warm ocean waters and river runoff. River runoff and ice melting have also contributed to changes in the amount and distribution of fresh water in the Arctic.
Further reading
Morison, J., R. Kwok, C. Peralta-Ferriz, M. Alkire, I. Rigor, R. Andersen, and M. Steele. 2012. Changing Arctic Ocean freshwater pathways. Nature 481, 66–70 (05 January 2012), doi:10.1038/nature10705.
Nghiem, S.V., P. Clemente-Colón, I.G. Rigor, D.K. Hall, and G. Neumann. 2012. Seafloor control on sea ice. Deep Sea Research Part II: Topical Studies in Oceanography, Volumes 77–80, 15 November 2012, pp. 52-61, ISSN 0967-0645, doi:10.1016/j.dsr2.2012.04.004.
Posted in Analysis
EDIT/END
http://nsidc.org/arcticseaicenews/
 = new reply since forum marked as read
Highlight:
NoneDon't highlight anything
5 newestHighlight 5 most recent replies
= new reply since forum marked as read
Highlight:
NoneDon't highlight anything
5 newestHighlight 5 most recent replies

CRH
(1,553 posts)Then we will have a good idea from where we are starting. Sea ice extent doesn't really tell much. I checked the PIOMAS site the other day and couldn't find a graphed volume for Oct 2012 in relations to other years.

joshcryer
(62,276 posts)
Response to joshcryer (Reply #2)
GliderGuider This message was self-deleted by its author.
happyslug
(14,779 posts)Now, I have to say, the collapse of the West Antarctic Ice Sheet (WAIS) has been a concern for at least 10 years and will remain a concern till it actually collapses, even if that is 20 years from now, but each year you have less and less ice around the Ice Sheets of the WAIS, and thus each year the chance of the collapse increases.
http://www.earthtimes.org/climate/west-antarctic-ice-shelf-nudge-push-collapse/1977/
http://www.antarcticglaciers.org/west-antarctic-ice-sheet/
Yes, that is the question every March, when the Southern Summer comes to an end and the West Antarctic Ice Shelves (WAIS) shrinks to they smallest amount and expose the West Antarctic Ice Sheets to direct interaction with the warmer waters of the Southern Ocean? (I use the term "warmer" for we are talking about Cold Water, but water at 33 degree Fahrenheit is still to warm to freeze).
http://www.utexas.edu/news/2012/05/10/ice_sheet/
http://www.sciencedaily.com/releases/2012/07/120725132208.htm
http://www.jsg.utexas.edu/news/2012/03/west-antarctic-ice-shelves-are-tearing-apart-at-the-seams/
http://www.sciencenews.org/view/generic/id/340580/title/Big_Antarctic_ice_sheet_appears_doomed
The present retreat of the WAIS over the last 100 years, is the first time it has retreated in over 12,000 years (since the end of the last ice Age):
http://www.sciencecodex.com/groundingline_retreat_of_the_west_antarctic_ice_sheet_from_inner_pine_island_bay_unprecedented-102063
Animation of Ocean Currents around the WAIS
http://www.nasa.gov/topics/earth/features/currents-ice-loss.html
http://www.sciencedaily.com/releases/2012/09/120919103610.htm
Evidence that the WAIS has collapsed before:
http://www.sciencedaily.com/releases/2012/05/120509111453.htm
http://www.caffreyforcongress.org/earth-island-journal-antarcticas-deep-impact-threat/
No consensus exists as to How and when the WAIS will collapse, thus it is missing form the 4th IPCC report, even while it was cited in the 3rd IPCC:
http://sss.sagepub.com/content/early/2012/06/26/0306312712448130.abstract?rss=1
4th Intergovernmental Panel on Climate Change (IPCC), 2007:
http://www.ipcc.ch/scripts/_session_template.php?page=_35ipcc.htm#.UKRxY-TLS88
The actual 4th Report of the IPCC, 2007:
http://www.ipcc.ch/pdf/assessment-report/ar4/syr/ar4_syr.pdf
The 3rd IPCC Report:
http://www.grida.no/publications/other/ipcc_tar/
Difference between ice on the Arctic and Antarctic:
http://nsidc.org/cryosphere/seaice/characteristics/difference.html
http://nsidc.org/icelights/2012/01/11/sea-ice-down-under-antarctic-ice-and-climate/