Environment & Energy
Related: About this forumNSIDC - Ten Lowest Arctic Sea Ice Extent Records All In Last Ten Years
The sun has set over the central Arctic Ocean and Arctic sea ice extent is now increasing. Sea ice extent in Antarctica appears to have passed its seasonal maximum. The peak Antarctic value recorded so far of over 20 million square kilometers (7.7 million square miles) sets a new record over the period of satellite observations.
Overview of Conditions
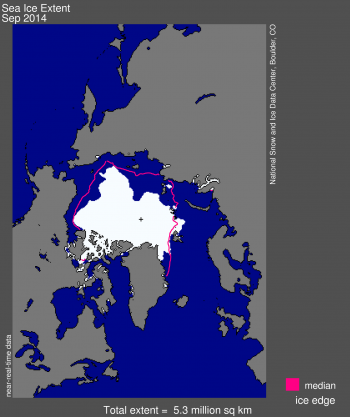
Following the seasonal daily minimum of 5.02 million square kilometers (1.94 million square miles) that was set on September 17, 2014 (6th lowest in the satellite record), Arctic sea ice has started its seasonal cycle of growth. Arctic sea ice extent averaged for the month of September 2014 was 5.28 million square kilometers (2.04 million square miles), also the 6th lowest in the satellite record. This is 1.24 million square kilometers (479,000 square miles) below the 1981 to 2010 average extent, and 1.65 million square kilometers (637,000 square miles) above the record low monthly average for September that occurred in 2012.
Conditions In Context
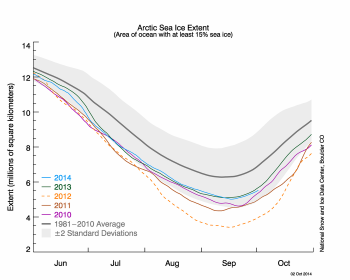
Because ice extent falls through the first part of September and rises in the latter part, statistics on the average daily rate of ice loss or gain through the month are largely meaningless. More relevant is the total ice loss through the melt season. Between the seasonal maximum extent that occurred on March 21, 2014 and the September 17 minimum, the Arctic Ocean lost a total of 9.89 million square kilometers (3.82 million square miles) of ice, which is the 9th largest in the satellite record, but the least amount of seasonal loss since 2006. This year’s loss was 1.92 million square kilometers 741,000 square miles) less than the total loss that occurred in 2012.
September 2014 Compared To Previous Years

Through 2014, the linear rate of decline for September Arctic ice extent over the satellite record is 13.3% per decade, relative to the 1981 to 2010 average. The ten lowest September ice extents over the satellite record have all occurred in the last ten years.
Summer Weather Conditions In 2014
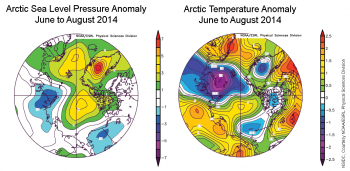
Figure 4. These images show June to August sea level pressure anomalies, compared to the 1981 to 2010 average, (left) and June to August temperature anomalies at the 925 hPa level, compared to the 1981 to 2010 average (right). At left, blues and purples indicate lower than average pressures, while greens, yellows, and reds indicate higher than average pressures. At right, reds and yellows indicate warmer than average temperatures, and blues and purples indicate lower than average temperatures.
Weather conditions prevailing over the summer of 2014 were unremarkable. Compared to the long term (1981 to 2010) climatology, sea level pressure over the period June through August was higher than average over much of the central Arctic Ocean, the Atlantic sector of the Arctic, and Greenland. While air temperatures at the 925 hPa level (approximately 3000 feet altitude) were slightly above average over part of the central Arctic Ocean, they were below average over the Kara Sea and just north of Alaska. The summer of 2013, which is now the 7th lowest ice extent in the satellite record, was also generally unremarkable in terms of temperature. Both of these years contrast sharply with 2012, which saw unusually warm conditions across the Arctic Ocean. The one significant weather pattern over the summer was a larger than normal pressure gradient over the Laptev Sea that drove southerly winds, brought warmer air, and helped drive sea ice northward. This led to the tongue of open water that reached to within 5 degrees latitude of the pole. However, this pressure gradient was not particularly extreme so thinner ice cover in the area was also a significant contributor to the open water near the pole. Sea surface temperatures may also have played a role, as we discussed in a previous post.
Ice Age
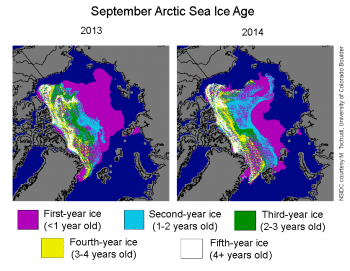
Figure 5. These images show the ages of ice in the Arctic at the end of September 2013 and 2014.
The distribution of sea ice age at the time of the minimum provides some insights into the summer evolution of the ice cover. For ice that is three years and older, the distribution is similar to recent years, with most of this ice along the northern coast of Greenland and northwestern coast of the Canadian Archipelago. Through the winter, older ice moved across the Beaufort and Chukchi seas due to the typical clockwise circulation of the Beaufort Gyre. Similar to recent summers, much of this ice melted away, though this year it lasted through most of the summer, contributing to the relatively late development of open water along the Alaskan coast.
One notable feature this year compared to last year is that a tongue of second-year ice (ice that is 1 to 2 years old) persisted north and east of the East Siberian Sea. This likely helped limit the loss of ice in this region and kept the ice edge much farther southward than in the neighboring Laptev Sea to the east. The predominance of thinner first-year ice in the Laptev region, along with persistent southerly winds, led to seasonal retreat of the ice edge to north of 85 degrees North latitude.
Sea Ice Maximum In Antarctica
As we reported in our Arctic minimum announcement, sea ice in Antarctica has remained at satellite-era record high daily levels for most of 2014. On September 22, 2014, Antarctic ice extent increased to 20.11 million square kilometers (7.76 million square miles). This was the likely maximum extent for the year.
This year’s Antarctic sea ice maximum was 1.54 million square kilometers (595,000 square miles) above the 1981 to 2010 average maximum extent, which is nearly four standard deviations above this average. The 2014 ice extent record is 560,000 square kilometers (216,000 square miles) above the previous record ice extent set on October 1, 2013. Each of the last three years (2012, 2013, and 2014) has set new record highs for extent in the Antarctic.
The monthly average Antarctic ice extent for September 2014 is 20.03 million square kilometers (7.73 million square miles). This is 1.24 million square kilometers (479,000 square miles) above the 1981 to 2010 average for September ice extent. The Antarctic sea ice trend for September is now +1.3% per decade relative to the 1981 to 2010 average.
Monthly averaged ice extent for September is well above average in the western Pacific (northern Ross Sea) and Indian Ocean (Enderby Land) sectors.
EDIT
http://nsidc.org/arcticseaicenews/