Science
Related: About this forumLatest Update on the Disastrous 2024 CO2 Data Recorded at Mauna Loa
As I've indicated repeatedly in my DU writings, somewhat obsessively I keep spreadsheets of the of the daily, weekly, monthly and annual data at the Mauna Loa Carbon Dioxide Observatory, which I use to do calculations to record the dying of our atmosphere, a triumph of fear, dogma and ignorance that did not have to be, but nonetheless is, a fact.
Facts matter.
When writing these depressing repeating posts about new records being set, reminiscent, over the years, to the ticking of a clock at a deathwatch, I often repeat some of the language from a previous post on this awful series, as I am doing here with some modifications. It saves time.
A recent post (not my last on this topic) reflecting the annual record being set is here:
A New Record Concentration for CO2, 427.98 ppm Has Been Set for the Mauna Loa CO2 Observatory's Weekly Average.
A more recent example, with a title of this series, which this post modifies slightly, is here:
Update on the Disastrous 2024 CO2 Data Recorded at Mauna Loa
We've just had another very, very, very bad week of data, that of the week beginning 7/28/2024.
This week's data:
Week beginning on July 28, 2024: 424.88 ppm
Weekly value from 1 year ago: 420.83 ppm
Weekly value from 10 years ago: 397.65 ppm
Last updated: August 04, 2024
Weekly average CO2 at Mauna Loa
There have been 2531 weekly data points such as that immediately above, recorded at the Mauna Loa CO2 Observatory which are available on the data pages of the website which compare the value with the same week of the previous year. The reading above, for week 30 of 2024, shows an increase of 4.05 ppm over week 30 of the previous year, 2023. Among all such increases for weekly data, again, 2531 of them, compared with the same week of the previous year, this is the 24th highest ever recorded. It is one of only 30 readings to exceed an increase of 4.00 ppm, nine of which took place in the current year. Four of these readings exceed increases of 5.00 ppm, three of which were in 2024. Of the top 50 week to week/year to year comparators 17 have taken place in the last 5 years of which 11 occurred in 2024, 39 in the last 10 years, and 45 in this century. Of the five readings from the 20th century, four occurred in 1998, when huge stretches of the Malaysian and Indonesian rainforests caught fire when slash and burn fires went out of control. These fires were set deliberately, designed to add palm oil plantations to satisfy the demand for "renewable" biodiesel for German cars and trucks as part of their "renewable energy portfolio." The only other reading from the 20th century to appear in the top 50 occurred in the week beginning August 21, 1988, which was 3.91 ppm higher than the same week of the previous year. For about ten years, until July of 1998, it was the highest reading ever recorded. It is now the 35th highest.
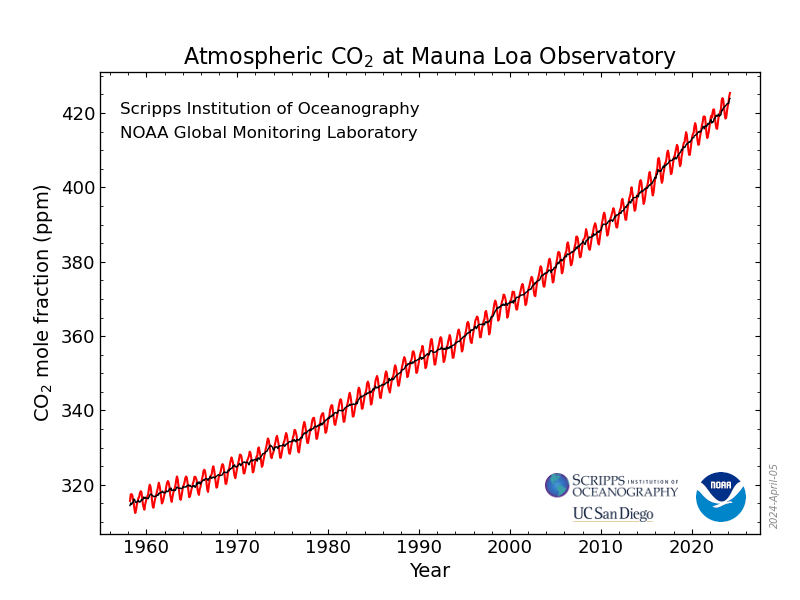
If one looks, one can see that the rate of accumulation recorded at the Mauna Loa CO2 Observatory is a sine wave superimposed on a roughly quadratic axis:

Monthly Average Mauna Loa CO2
An interesting and disturbing thing about this week's reading is where it stands among comparators with the reading of ten years previous. Note that this reading is 27.23 ppm higher than it was in week 30 of 2014, implying that the rate of accumulation is 2.72 ppm year. Of all such ten year comparators among the 2531 readings, this is the second highest ever recorded. The highest, 27.65 ppm occurred earlier this year, in the week beginning February 4, 2024, week 5, which also gave the highest single year comparator, that with week 5 of 2023, where it was 5.75 ppm higher.
Actually, there is a considerable, but not dramatic, amount of statistical noise in these readings, and to "smooth" things, I keep a 52 week running average of the ten year comparators. This is also the highest ever observed; on average over the last 52 weeks, readings are 25.20 ppm higher than they were 10 years earlier.
Ten years ago, week 30 of 2014, this 52 week running average reaching back to 2003 and 2004 was 20.76 ppm/10 years.
Referring to the crude quadratic axis in the graphic above, one can make a rough model of the behavior of this system, using simple high school level calculus, by treating the rate of change in the rate of change - the change in the 52 week average comparators - as a second derivative with respect to time (in years), integrating twice, and using, as boundary conditions, the 1 year comparator, and the current reading. In my spreadsheet I do this automatically. If one solves the resulting equation using the quadratic formula to see when we will hit 500 ppm, one will see this should take place in 2045. The crude equation predicts that in 2050 the concentration of the dangerous fossil fuel waste will be somewhere between 519 and 520 ppm.
Things are getting worse faster.
People lie, to each other and to themselves, but numbers don't lie.
The same media that loves to promote a seriously intellectually crippled serial rapist, con man and felon as a viable Presidential candidate likes to talk about a so called "energy transition" that is supposed to save our asses.
This highly advertised propaganda is connected with the unsupportable belief that the vast sums of money spent so called "renewable energy," which I personally regard as reactionary as the six thugs of the apocalypse in the rogue US Supreme Court, is about addressing climate change.
It isn't.
The reactionary impulse to make our energy supplies dependent on the weather, this precisely at the time we have destabilized the weather by lying to ourselves about our continuous and rising use of dangerous fossil fuels, was always an ignorant attack on nuclear energy.
All the money is clearly wasted and ineffective. How much money is it?
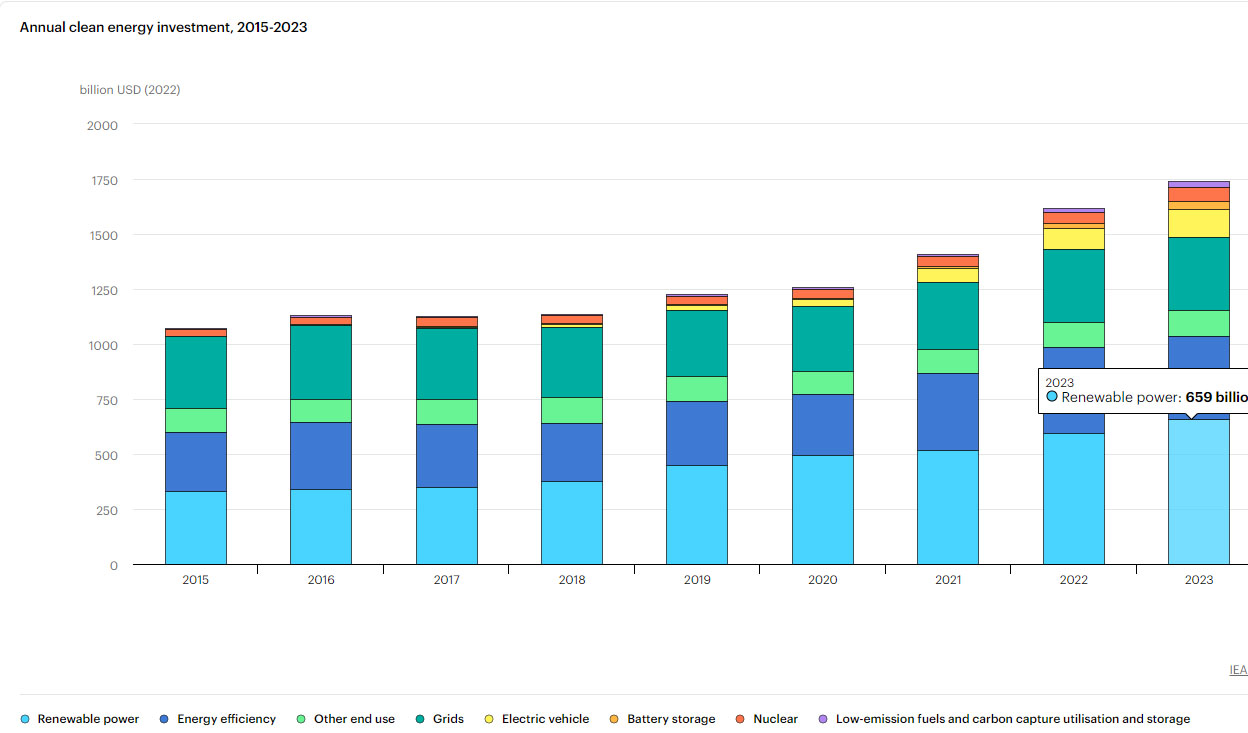
The amount of money spent on so called "renewable energy" since 2015 is 4.12 trillion dollars, compared to 377 billion dollars spent on nuclear energy, much of the latter to prevent the willful and deadly destruction of existing nuclear infrastructure.

IEA overview, Energy Investments.
The graphic is interactive at the link; one can calculate overall expenditures on what the IEA dubiously calls "clean energy," ignoring the fact that the expenditure on so called "renewable energy" is basically a front for maintaining the growing use of fossil fuels.
I fully expect our nominee, VP Harris, to have profited by her exposure to what I regard as the most important climate policy of the best Presidential Administration of my lifetime: The embrace of nuclear energy.
The Biden administration has rightly described itself as promoting "the largest sustained push to accelerate civil nuclear deployment in the United States in nearly five decades."
White House holds summit on US nuclear energy deployment
My strong opinion that nuclear energy is the last best hope of the planet is not subject to change by appeals to clap trap about so called "nuclear waste," Fukushima, Chernobyl (and even more silly) Three Mile Island, blah, blah, blah...
I suggest finding someone more credulous than I to whom to chant endlessly about these points. Take a drive in your swell car out to a "no nukes" concert and convincing yourself that rock stars know more about energy than engineers and scientists. You deserve it. Whether future generations suffer in extreme poverty because of your smug pleasures is not your concern.
Do all these things. Don't worry. Be happy.
As for me, I'm far more concerned with the collapse of the planetary atmosphere than I am with the fear that someone somewhere at sometime may die from an industrial accident involving radiation. Let me repeat: I am far more concerned with the vast death toll, extreme environmental destruction, and the global heating associated with the normal use of dangerous fossil fuels. Nuclear energy is not risk free, nor will it ever be. It is simply vastly superior to all other options, which in a rational world would be enough to embrace it.
In any case I am certainly prone to thank our current President for his hard work to press for the expansion of nuclear energy, since very clearly we are out of time. I look forward to a Harris administration embracing this important legacy of President Biden.
When our country, as precious as it has been to us, is an ancient memory, the rot we left behind in the planetary atmosphere will still persist.
I am pleased to repeat once more and to note that history will record that Joe Biden was a leader in doing something, perhaps not enough to come close to addressing the problem - that was politically impossible I think because of the hyping of ignorance - but again, Joe Biden did something. He showed us, in his wisdom, a path forward.
As for the rest of us, history will not forgive us, nor should it.
masmdu
(2,634 posts)NNadir
(36,839 posts)...that nuclear fission has set for reliability.
It's 2024. The global heating catastrophe is taking place now not "by 2050."