2016 Postmortem
Related: About this forumHere is why I expect Bernie to win big in NY.
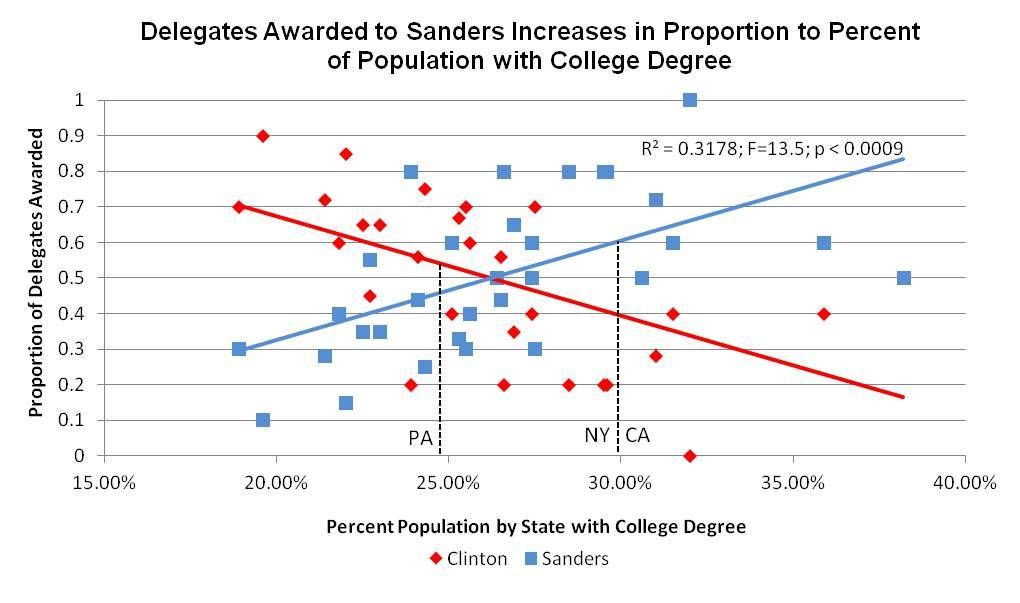
Sanders does better across the board with an educated population by a significant margin. My wager is that NY and CA are his, while Hillary gets PA. The question really is by what margins they each win.
 = new reply since forum marked as read
Highlight:
NoneDon't highlight anything
5 newestHighlight 5 most recent replies
= new reply since forum marked as read
Highlight:
NoneDon't highlight anything
5 newestHighlight 5 most recent replies

MadBadger
(24,089 posts)revbones
(3,660 posts)I'm assuming that graphic was originally interactive. I'd like to see where the which states were which.

Nyan
(1,192 posts)It's quite telling.
geek tragedy
(68,868 posts)SoLeftIAmRight
(4,883 posts)it is so very obvious - all other things being equal - smarter people vote for Sanders

frustrated_lefty
(2,774 posts)Using excel to graph education by state vs. election results. State education is taken from government published census data, election results are taken from the primaries to date. Every data point has a counterpoint. If Hillary wins by 0.8, Sanders receives 0.2 on the y axis.
JonLeibowitz
(6,282 posts)Can you share you primary data sources?
frustrated_lefty
(2,774 posts)Of course, they are available. The primary education data is from https://en.wikipedia.org/wiki/List_of_U.S._states_by_educational_attainment which draws from the 2012 census. The electoral results are drawn from, well, the electoral results. Sorry the individual states aren't identified at data points, but that would clutter things immensely.

Ash_F
(5,861 posts)frustrated_lefty
(2,774 posts)Single metrics are for fun as predictors. The only thing I would note is that the deviation is primarily in the 50% of the vote range. At the extremes, the metrics are less variable. My bets, again, are Sanders in NY and CA with Clinton winning PA. Margins will decide the outcome.