Welcome to DU!
The truly grassroots left-of-center political community where regular people, not algorithms, drive the discussions and set the standards.
Join the community:
Create a free account
Support DU (and get rid of ads!):
Become a Star Member
Latest Breaking News
Editorials & Other Articles
General Discussion
The DU Lounge
All Forums
Issue Forums
Culture Forums
Alliance Forums
Region Forums
Support Forums
Help & Search
Environment & Energy
In reply to the discussion: All Together Now! Microplastic Pollution, Ocean Acidification, Halogenated Methanes, Ozone Collapse... Delicious! [View all]
NNadir
(36,333 posts)5. The paper to which the news report refers is of a limited time scale, attributing recent observations to "noise."
It is here: Wang, P., Solomon, S., Santer, B.D. et al. Fingerprinting the recovery of Antarctic ozone. Nature 639, 646–651 (2025).
From the text:
Despite the decline in ODSs3, the continuing occurrence of large Antarctic ozone ‘holes’ in recent years—partly because of the 2020 Australian wildfire13,14,15 and 2022 Hunga volcanic eruption16,17,18,19—along with concerns about a substantial decrease in October mid-stratospheric ozone20, have stimulated discussion about the detectability of a robust signal in Antarctic ozone recovery. Formal detection and attribution (D&A) methods are needed to assess the effectiveness of the Montreal Protocol.
Initial-condition large ensembles (LEs) generated with fully coupled global climate models offer a unique opportunity to ‘fingerprint’ the anthropogenic influence. They provide valuable information on both natural internal variability and the characteristic space and time signatures of the climate responses to different external forcings5,6,7,8,9,10,11,12. Such ensembles are rarely used in ozone studies, which generally apply multiple linear regression to isolate underlying forced trends by fitting ozone time series to known sources of variability (such as the solar cycle, El Niño–Southern Oscillation, quasi-biennial oscillation, volcanic activities etc.)4,21. By contrast, LEs do not require the assumption that the response is a linear combination of independent predictor variables22. Although some D&A methods have been applied to global ozone depletion and the time of emergence of total column recovery using multi-model ensembles23,24,25, previous studies have not fully used the pattern-based D&A techniques. Furthermore, several members from a single model that is well evaluated and realistic can reliably quantify modelled forced signals and intrinsic variability, whereas one run from each of a multi-model ensemble samples larger cross-model differences in forcing, response and variability26, thus hampering the identification of the beginning of ozone recovery23,24....
Initial-condition large ensembles (LEs) generated with fully coupled global climate models offer a unique opportunity to ‘fingerprint’ the anthropogenic influence. They provide valuable information on both natural internal variability and the characteristic space and time signatures of the climate responses to different external forcings5,6,7,8,9,10,11,12. Such ensembles are rarely used in ozone studies, which generally apply multiple linear regression to isolate underlying forced trends by fitting ozone time series to known sources of variability (such as the solar cycle, El Niño–Southern Oscillation, quasi-biennial oscillation, volcanic activities etc.)4,21. By contrast, LEs do not require the assumption that the response is a linear combination of independent predictor variables22. Although some D&A methods have been applied to global ozone depletion and the time of emergence of total column recovery using multi-model ensembles23,24,25, previous studies have not fully used the pattern-based D&A techniques. Furthermore, several members from a single model that is well evaluated and realistic can reliably quantify modelled forced signals and intrinsic variability, whereas one run from each of a multi-model ensemble samples larger cross-model differences in forcing, response and variability26, thus hampering the identification of the beginning of ozone recovery23,24....
Figures from the text:
 ?as=webp
The caption:
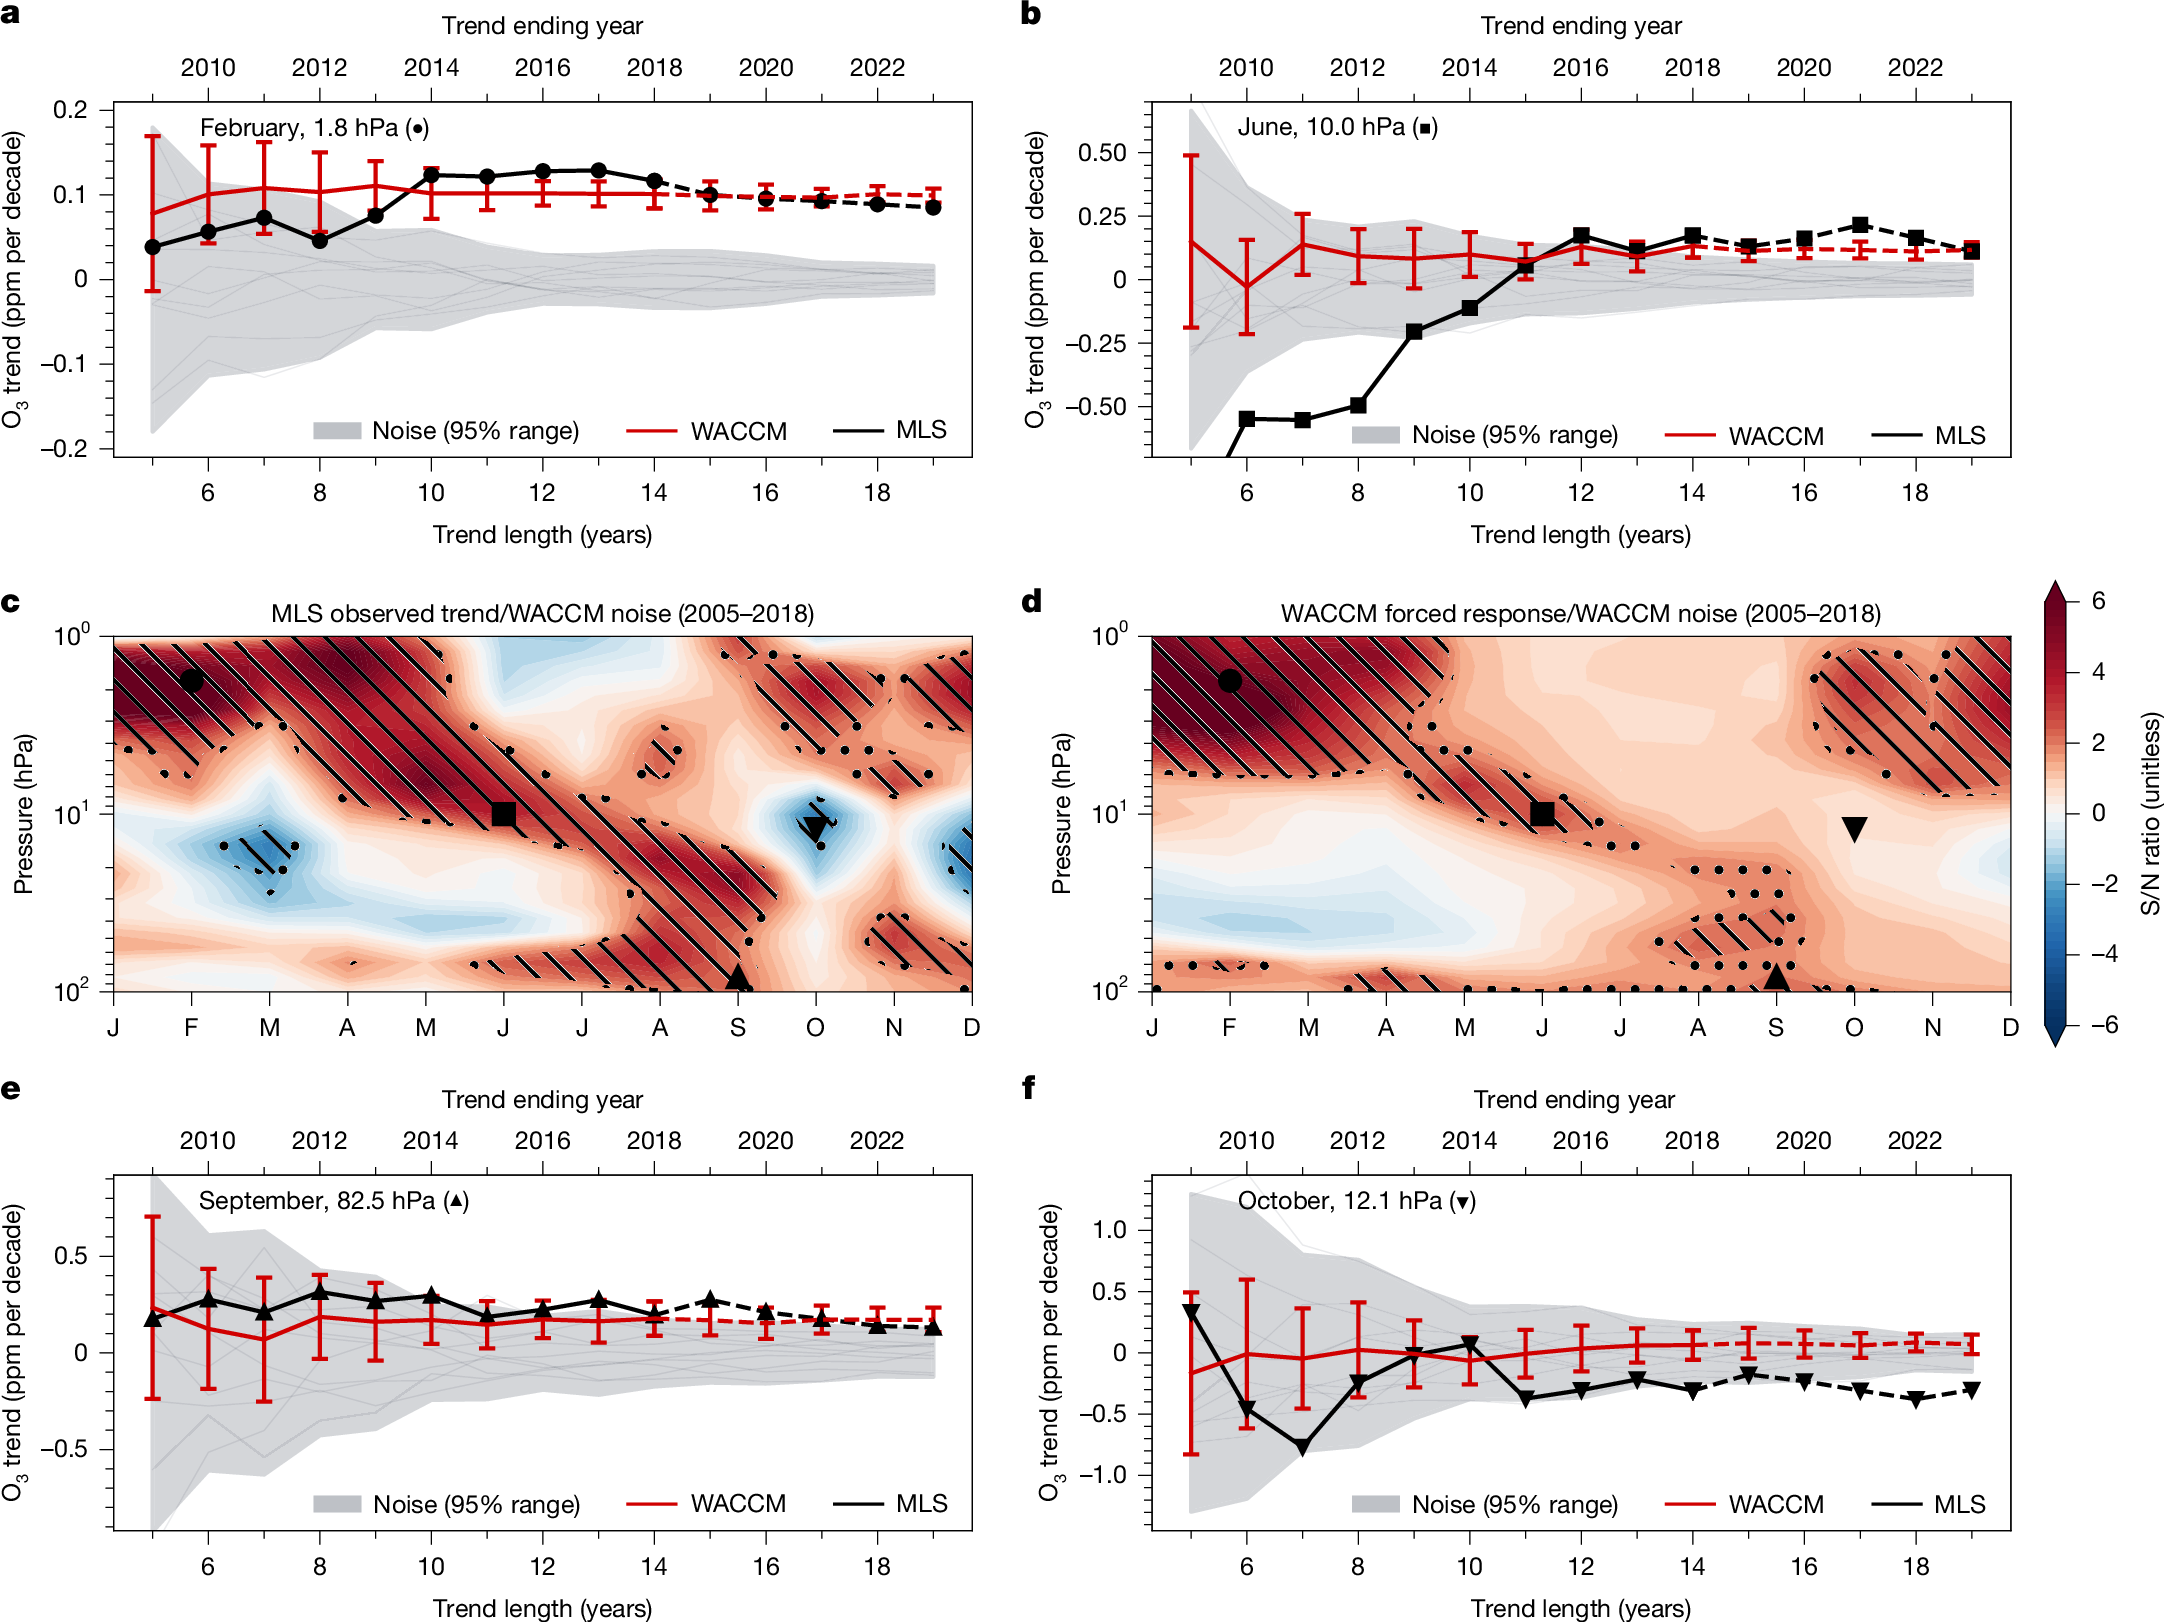
The middle panels show the month–height patterns of the observed ozone trends in the MLS (c) and the WACCM ten-member ensemble mean refC2 ozone trends (d) divided by the internal variability noise in refC2 trends (which are given in Fig. 2b). Results are for trends over 2005–2018; Extended Data Fig. 5 similarly shows local S/N for trends calculated over 2005–2023. Hatched regions indicate that the local trend is significantly outside the noise at the 5% (backslashes) and 10% (dots) levels. The top and bottom rows (panels a, b, e and f) provide the local signal and noise as a function of trend length at the same four illustrative months/heights shown in Fig. 1. The thin grey lines are the trends resulting from internal variability in each model realization and the grey shading indicates the 95% range of the realization spread. Thick lines are the trends from the MLS (black) and the WACCM ensemble mean (red). The error bars on the red line indicate ±1 standard deviation in the ten-member ensemble.
 ?as=webp
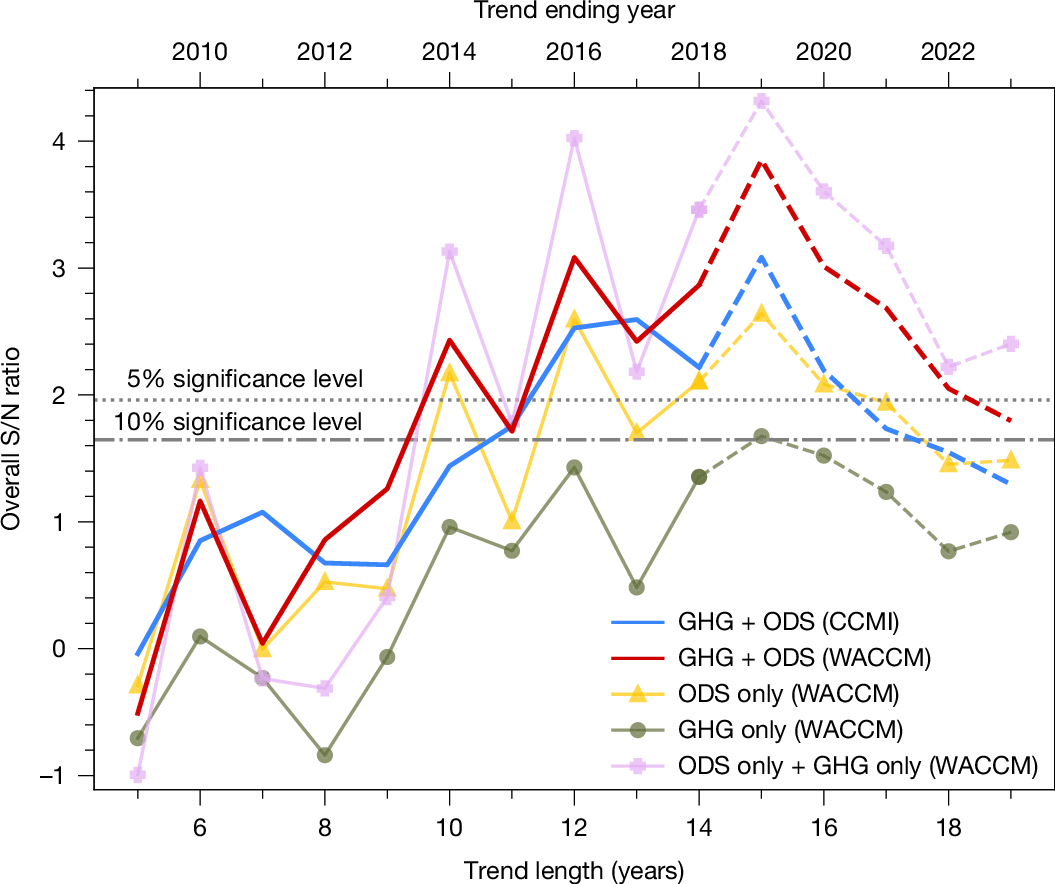
The numerator of the S/N ratio is the element-wise covariance in the overall month–height ozone trend patterns between the MLS and the ensemble means of the coupled GHG + ODS runs from the WACCM (red) or the CCMI (blue), calculated at trend lengths ranging from 5 to 19 years. The denominator of the ratio is the standard deviation of the element-wise covariance computed between individual noise patterns and the ensemble-mean responses. The observed MLS ozone trend pattern is also projected onto the ODS-only and GHG-only fingerprints from the WACCM, shown in yellow and dark green, respectively (a linear addition of these two separate forcing results is shown by the mauve line). An overall S/N value above the grey dashed or dash-dotted lines indicates that the similarity between the observed month–height pattern and the model-predicted forced response pattern (to GHG, ODS or combined GHG + ODS changes) is significant at the 5% or 10% level, respectively, and is therefore unlikely to be explained by internal variability alone.
The question that needs to be asked is whether the rate of a presumed "recovery" will slow as bromination described in the paper grows to match the issue that arose with manufactured CFCs.
Hopefully you are correct but I'm not sure that what is described in the OP may overwhelm the current trend.
Edit history
Please sign in to view edit histories.
Recommendations
0 members have recommended this reply (displayed in chronological order):
5 replies
 = new reply since forum marked as read
Highlight:
NoneDon't highlight anything
5 newestHighlight 5 most recent replies
RecommendedHighlight replies with 5 or more recommendations
= new reply since forum marked as read
Highlight:
NoneDon't highlight anything
5 newestHighlight 5 most recent replies
RecommendedHighlight replies with 5 or more recommendations
= new reply since forum marked as read
Highlight:
NoneDon't highlight anything
5 newestHighlight 5 most recent replies
RecommendedHighlight replies with 5 or more recommendations