Welcome to DU! The truly grassroots left-of-center political community where regular people, not algorithms, drive the discussions and set the standards. Join the community: Create a free account Support DU (and get rid of ads!): Become a Star Member Latest Breaking News General Discussion The DU Lounge All Forums Issue Forums Culture Forums Alliance Forums Region Forums Support Forums Help & Search

OKIsItJustMe

(19,938 posts)
5. Greenhouse Gas Emissions by Economic Sector
Sat Oct 3, 2015, 10:42 AM
Oct 2015

Last edited Sat Oct 3, 2015, 11:39 AM - Edit history (1)

https://www.ipcc.ch/pdf/assessment-report/ar5/wg1/WG1AR5_Chapter08_FINAL.pdf

Figure 8.34 | Net global mean temperature change by source sector after (a) 100 and (b) 20 years (for 1-year pulse emissions). Emission data for 2008 are taken from the EDGAR database. For BC and OC anthropogenic emissions are from Shindell et al. (2012a) and biomass burning emissions are from Lamarque et al. (2010), see Supplementary Material Section 8.SM.17. There are large uncertainties related to the AGTP values and consequentially also to the calculated temperature responses (see text).


[HR]

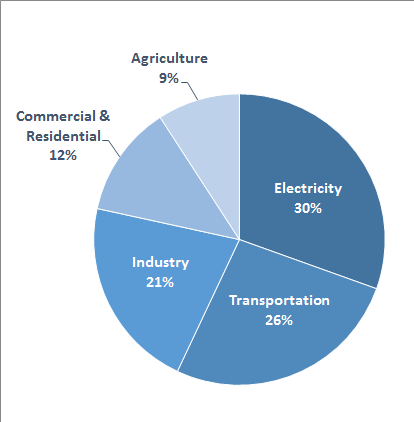
Total U.S. Greenhouse Gas Emissions by Economic Sector in 2013
http://www3.epa.gov/climatechange/ghgemissions/sources.html


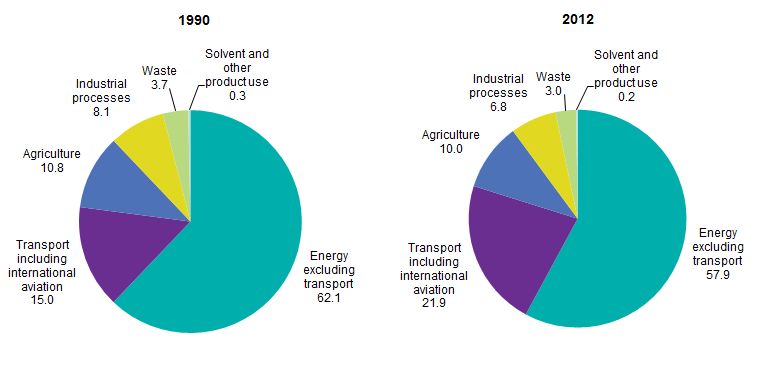
Greenhouse gas emissions, by source sector, EU-28, 1990 and 2012
http://ec.europa.eu/eurostat/statistics-explained/index.php/File:Greenhouse_gas_emissions,_by_source_sector,_EU-28,_1990_and_2012.png


Latest Discussions»Issue Forums»Environment & Energy»The single largest source...»Reply #5