Arctic sea ice extent on July 16 fell roughly between the extent for the same day in 2007 and the long-term average. The spatial pattern of summer ice loss has evolved differently from last year; this reflects the prevailing pattern of atmospheric circulation. Areas of low-concentration ice are also developing at unusually high latitudes.
Note: Analysis updates, unless otherwise noted, now show a single-day extent value for Figure 1, as opposed to the standard monthly average. While monthly average extent images are more accurate in understanding long-term changes, the daily images are helpful in monitoring sea ice conditions in near-real time.
Overview of conditions
Arctic sea ice extent on July 16 stood at 8.91 million square kilometers (3.44 square miles). While extent was below the 1979 to 2000 average of 9.91 square kilometers (3.83 million square miles), it was 1.05 million square kilometers (0.41 million square miles) above the value for July 16, 2007 (see Figures 1 and 2).
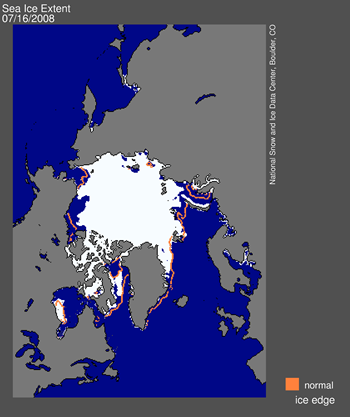
Figure 1. Daily Arctic sea ice extent for July 16, 2008 was 8.91 million square kilometers (3.44 million square miles). The orange line shows the 1979-2000 average extent for that day. About the data.
Conditions in context
The current pattern of sea ice retreat is noticeably different than last summer, with some areas showing less ice and others showing more. For example, in mid-July 2007, a large area of the southern Beaufort Sea north of Alaska still had ice; this year, it is already ice-free (see Figure 1). in 2007, large areas along the Siberian coast had melted out by mid-July; as of July 16, 2008, the Siberian sector remained largely ice-covered. Although the Siberian area still shows ice, satellite data reveals that the ice is low concentration and thus prone to melting.
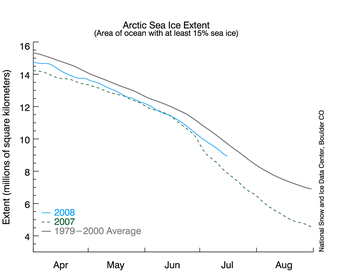
Figure 2. Daily sea ice extent; the blue line indicates 2008; the gray line indicates extent from 1979 to 2000; the dotted green line shows extent for 2007. Credit: Nati
Colleagues at the University of Bremen, Germany post daily satellite images from the NASA Advanced Microwave Sounding Radiometer (AMSR) at
http://www.iup.uni-bremen.de:8084/amsr/amsre.html. The images not only show the low ice concentrations in the Siberian sector discussed above; they also show that a large part of the northern Beaufort Sea is covered by ice with low concentrations of 50 to 75 percent, and is likely to melt out soon. An unusual area of low ice
Winds from the south
The spatial pattern of sea ice concentration, discussed above, is influenced by atmospheric circulation patterns. Figure 3 shows the pattern of sea-level pressure averaged over the three-week period from June 23 through July 13, 2008.
Winds tend to blow parallel to the isobar lines with a strength proportional to the pressure gradient; the closer the spacing between the isobars, the stronger the wind. The direction of the wind is determined from Buys Ballot's Law, which states that if you are standing with your back to the wind in the Northern Hemisphere, low pressure will be on your left, and high pressure will be on your right.
So, from Figure 3, we can see that the tightly spaced isobars between the high-pressure cell in the Canadian Arctic Islands and lower pressure in the East Siberian Sea points to strong and persistent winds from the south. This wind pattern helps transport sea ice poleward, away from the Alaska coast, and favors the development of open water in the area.
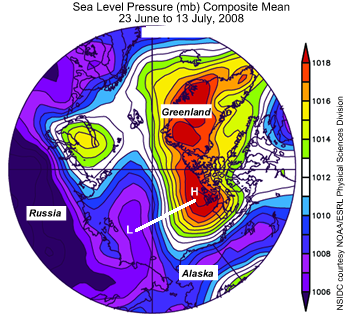
Figure 3: Above is a map of sea-level pressure, averaged for the the three-week period from June 23 through July 13, 2008. Areas of high pressure are shown in yellow and red; areas of low pressure are shown in blue and purple.Thin lines indicate isobars, which connect areas of equal pressure. Winds between high- and low-pressure areas, indicated by "H" and "L" respectively, are from the south.
Warm winds contribute to melt
In addition to pushing sea ice poleward, winds from the south tend to be warmer. Figure 4 shows a map of air-temperature anomalies averaged for the three-week period from June 23 through 13, 2008. While temperatures over most of the Arctic Ocean have been above normal, they have been particularly warm north of Alaska. There, persistent winds from the south are causing strong melt and reduced ice concentrations.
How is this different from what we saw in the record-breaking year 2007? In early July 2007, an atmospheric pattern developed that featured high pressure over the Beaufort Sea. This pattern promoted especially strong sea ice loss. The pattern that has dominated the summer of 2008, so far, seems less favorable for ice loss. However, the melt season has a long way to go. Furthermore, as discussed above, large areas of the pack ice with fairly low concentrations are likely to melt out soon.
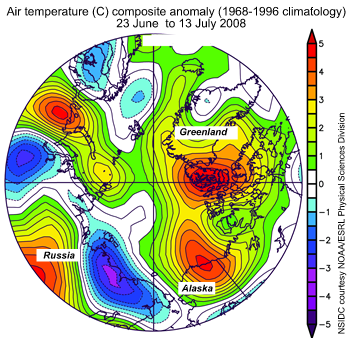
Figure 4. This image is a map of air-temperature anomalies at the 925 millibar level (about 3,000 feet above the surface), averaged for the three-week period from June 23 through July 13, 2008. Yellow and red indicate areas with above-average temperature; blue and purple indicate areas with below-average temperature.
EDIT
http://nsidc.org/arcticseaicenews/index.html