August 25, 2008
Arctic shortcuts open up; decline pace steady
Sign up for the Arctic Sea Ice News RSS feed for automatic notification of analysis updates.
Sea ice extent is declining at a fairly brisk and steady pace. Surface melt has mostly ended, but the decline will continue for two to three more weeks because of melt from the bottom and sides of the ice. Amundsen's Northwest Passage is now navigable; the wider, deeper Northwest Passage through Parry Channel may also open in a matter of days. The Northern Sea Route along the Eurasian coast is clear.
Overview of conditions
Arctic sea ice extent on August 24 was 5.47 million square kilometers (2.11 million square miles), a decline of 1.85 million square kilometers (714,000 square miles) since the beginning of the month. Extent is now within 580,000 square kilometers (220,000 square miles) of last year's value on the same date and is 1.84 million square kilometers (710,000 square miles) below the 1979 to 2000 average.
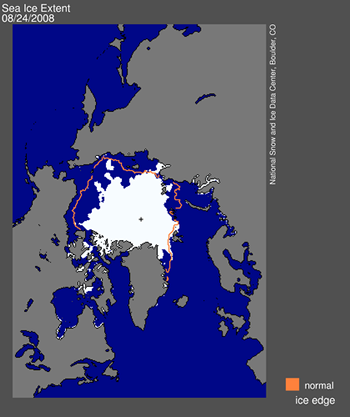
Figure 1. Daily Arctic sea ice extent for August 24, 2008, was 5.47 million square kilometers (2.11 million square miles). The orange line shows the 1979 to 2000 average extent for that day. The black cross indicates the geographic North Pole. Sea Ice Index data.
Conditions in context
Since our August 11 update, sea ice extent has declined at a fairly steady yet brisk pace. Since August 8, atmospheric circulation has settled into a pattern with high pressure covering most of the Beaufort, Chukchi, and East Siberian Seas. Recent ice losses have been most pronounced along the northern edge of eastern Siberia, which is consistent with generally southerly winds and above-average temperatures in this region.
Based on NASA Advanced Microwave Scanning RadiometerEarth Observing System (AMSR-E) satellite images from the University of Bremen the wider, deeper Northwest Passage through the Parry Channel is almost open. The United States National Ice Center confirms that Amundsen's Northwest Passage is navigable. The AMSR-E data furthermore indicate that the Northern Sea Route (also called the Northeast Passage) is open.
Last August, the Amundsen and Parry Channel routes both opened, but the Northern Sea Route remained blocked.
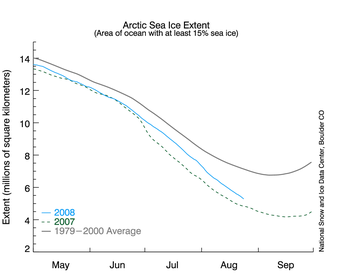
Figure 2. Daily sea ice extent; the blue line indicates 2008; the gray line indicates extent from 1979 to 2000; the dotted green line shows extent for 2007.
Animation provides a closer look at the melt
NSIDC has released new animations for Google Earth showing daily sea ice concentrations and extent in the Arctic. Click on the still image in Figure 3 to view a Quick Time animation of daily sea ice concentration over the past 90 days. Note the recent strong losses of ice north of Siberia.
Users who wish to manipulate the animation and access the daily updated animation may now download them from the NSIDC Virtual Globes page. Daily sea ice extent updates are automatically loaded into Google Earth so users always have the most recent files; 30-, 60-, and 90-day versions are available. To download the Google Earth files, learn more about Google Earth, or to find out how to read the time-slider tutorial, see
http://nsidc.org/data/virtual_globes/. 
Figure 3. Click for an animation of daily sea ice concentration for the past 90 days; the gray circle indicates where the satellite does not provide data coverage. SSM/I satellite data.
Changing ice thickness
As discussed in a number of previous postings (July 17, April 7), sea ice thickness is a key measure of the health of the sea ice. While the NASA ICESat sensor can give an overall picture of ice thickness over the Arctic Ocean, the most accurate way to measure ice thickness is by taking point measurements on the ground. Don Perovich, Jackie Richter-Menge, Bruce Elder, and Chris Polashenski at the United States Army Cold Regions Research and Engineering Laboratory track the evolution of sea ice thickness year round using autonomous buoys. The buoys are deployed as part of the North Pole Environmental Observatory, the Beaufort Gyre Observatory, and the DAMOCLES project. The buoy data have indicated increased amounts of melt on the underside of the ice cover in recent years; bottom melt last year was particularly extreme.
The pattern for 2008 has been more mixed. The ice at some buoy locations has thinned by more than a meter through the melt season because of strong melt both on the surface and the underside of the ice. Other locations show strong thinning caused by surface melt, while only modest thinning is apparent in others. Differences in surface melt from location to location reflect factors such as air temperature, the ice albedo, and cloud conditions. The wide range in bottom melt points to variations in the amount of ocean heat absorbed. In recent days, the buoys have indicated sub-freezing temperatures with surface melt coming to an end; however, bottom melt will continue for at least two to three more weeks and the ice extent decline, while slowing, will also continue.
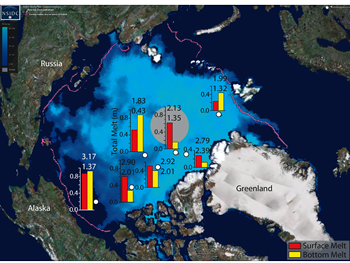
Figure 4. Ice thickness measurements for summer 2008 indicate melt at the ice surface (red) versus the underside (yellow). This image shows changes in ice thickness at buoy locations (white circles), overlaid on the NSIDC sea ice concentration field for August 20. The numbers above each bar plot indicate total ice thickness at the beginning of the melt season compared to August 20.
EDIT/END
http://nsidc.org/arcticseaicenews/index.html