Democratic Underground Latest Greatest Lobby Journals Search Options Help Login
Google

Science - "Unlikely" That 2C Goal Remains Attainable, No Matter What Happens Next

Printer-friendly format Printer-friendly format
Printer-friendly format Email this thread to a friend
Printer-friendly format Bookmark this thread
This topic is archived.
Home » Discuss » Topic Forums » Environment/Energy Donate to DU
 
hatrack Donating Member (1000+ posts) Send PM | Profile | Ignore Mon Apr-11-11 12:11 PM
Original message
Science - "Unlikely" That 2C Goal Remains Attainable, No Matter What Happens Next
International negotiators at a United Nations-sponsored climate conference ending today in Bangkok repeatedly underscored the goal of keeping the amount of global warming in this century to no more than 2˚C. But results from a Canadian government climate modeling study published last month suggest that “it is unlikely that warming can be limited to the 2˚C target,” the scientists who wrote the study say.

The paper finds that reaching that goal would require that greenhouse emissions “ramp down to zero immediately” and that scientists deploy means, starting in 2050, to actively remove greenhouse gases from the atmosphere. Previous modeling efforts have already highlighted the difficulty of reaching the 2˚C goal. But the new study is unique in several ways. Most important, it relies on the first published results from the latest generation of so-called Earth System climate models, complex programs that run on supercomputers and seek to simulate the planet’s oceans, land, ice, and atmosphere. The model in this study, Canadian Earth System Model 2, also incorporates updated data on volcanic eruptions, and it simulates in a more sophisticated way the biosphere’s ability to take in or emit carbon.

In the study, scientists with Environment Canada, a government agency, fed their model various scenarios of future greenhouse gas concentrations out to the year 2100. In the scenario with the most carbon emissions, the concentration of CO2 in the atmosphere skyrocketed from its current level, about 390 parts per million, to 920 ppm, and global land surface temperature rose by 4.9˚C above 2005 levels. But even in a scenario in which emissions cuts caused CO2 levels to peak at 450 ppm in 2050, temperatures rose by 2.3˚C by the end of the century, above the 2˚C goal.

In one figure in the paper, the highest-emissions pathway was depicted with an orange line, with the lowest-emissions line in blue. “In terms of emissions, right now we’re more likely on the orange line than on the blue, “ said co-author Ken Denman, an oceanographer at the University of Victoria in Canada who is affiliated with Environment Canada. Much higher temperatures may await humanity if emissions aren’t reduced quickly, and the difficulty of reaching the 2˚C goal may be irrelevant, he says.

EDIT

http://news.sciencemag.org/sciencenow/2011/04/un-goal-of-limiting-global-warmi.html
Printer Friendly | Permalink |  | Top
pscot Donating Member (1000+ posts) Send PM | Profile | Ignore Mon Apr-11-11 12:20 PM
Response to Original message
1. And now back to
Dancing with the Stars!
Printer Friendly | Permalink |  | Top
 
FBaggins Donating Member (1000+ posts) Send PM | Profile | Ignore Mon Apr-11-11 12:54 PM
Response to Original message
2. Is this REALLY such a big deal?
I mean... it isn't as if many people will die from global warming, is it?
Printer Friendly | Permalink |  | Top
 
RaleighNCDUer Donating Member (1000+ posts) Send PM | Profile | Ignore Mon Apr-11-11 12:58 PM
Response to Reply #2
3. LOL
You forgot your sarcasm smiley.


Didn't you?
Printer Friendly | Permalink |  | Top
 
Tesha Donating Member (1000+ posts) Send PM | Profile | Ignore Sun Apr-17-11 07:41 AM
Response to Reply #3
78. FBaggins is all for fighting global climate change just so long...
...as the principal weapon we use in the fight is
a massive switch to obtaining all of our energy
from nuclear fission.

Tesha
Printer Friendly | Permalink |  | Top
 
FBaggins Donating Member (1000+ posts) Send PM | Profile | Ignore Mon Apr-18-11 10:15 PM
Response to Reply #78
84. Not at all.
I'm for a massive switch toward nuclear AND wind AND solar AND new hydro options and away from coal and (eventually) natural gas.

If you want to entirely get rid of nuclear power AFTER we get rid of the far more dangerous/damaging coal... I'm all for it.
Printer Friendly | Permalink |  | Top
 
OKIsItJustMe Donating Member (1000+ posts) Send PM | Profile | Ignore Mon Apr-11-11 02:00 PM
Response to Original message
4. Carbon emission limits required to satisfy future representative concentration pathways of greenhous
Edited on Mon Apr-11-11 02:00 PM by OKIsItJustMe
http://www.agu.org/pubs/crossref/2011/2010GL046270.shtml
GEOPHYSICAL RESEARCH LETTERS, VOL. 38, L05805, 6 PP., 2011
http://dx.doi.org/10.1029/2010GL046270">doi:10.1029/2010GL046270

Carbon emission limits required to satisfy future representative concentration pathways of greenhouse gases


The response of the second-generation Canadian earth system model (CanESM2) to historical (1850–2005) and future (2006–2100) natural and anthropogenic forcing is assessed using the newly-developed representative concentration pathways (RCPs) of greenhouse gases (GHGs) and aerosols. Allowable emissions required to achieve the future atmospheric CO2 concentration pathways, are reported for the RCP 2.6, 4.5 and 8.5 scenarios. For the historical 1850–2005 period, cumulative land plus ocean carbon uptake and, consequently, cumulative diagnosed emissions compare well with observation-based estimates. The simulated historical carbon uptake is somewhat weaker for the ocean and stronger for the land relative to their observation-based estimates. The simulated historical warming of 0.9°C compares well with the observation-based estimate of 0.76 ± 0.19°C. The RCP 2.6, 4.5 and 8.5 scenarios respectively yield warmings of 1.4, 2.3, and 4.9°C and cumulative diagnosed fossil fuel emissions of 182, 643 and 1617 Pg C over the 2006–2100 period. The simulated warming of 2.3°C over the 1850–2100 period in the RCP 2.6 scenario, with the lowest concentration of GHGs, is slightly larger than the 2°C warming target set to avoid dangerous climate change by the 2009 UN Copenhagen Accord. The results of this study suggest that limiting warming to roughly 2°C by the end of this century is unlikely since it requires an immediate ramp down of emissions followed by ongoing carbon sequestration in the second half of this century.
Printer Friendly | Permalink |  | Top
 
XemaSab Donating Member (1000+ posts) Send PM | Profile | Ignore Mon Apr-11-11 02:25 PM
Response to Original message
5. Like sands through the hourglass...
:D
Printer Friendly | Permalink |  | Top
 
txlibdem Donating Member (1000+ posts) Send PM | Profile | Ignore Mon Apr-11-11 02:26 PM
Response to Original message
6. I keep telling you people: all you have to do is make me Emperor of the Universe
and I will straighten out all of these little problems for you. Whoops, in order for my solutions to work there might be some "accidental" seizure of all assets of anyone whose net worth is over a certain limit, say $2 million.
Printer Friendly | Permalink |  | Top
 
n2doc Donating Member (1000+ posts) Send PM | Profile | Ignore Mon Apr-11-11 03:02 PM
Response to Original message
7. Say goodbye to the Arctic ice cap
From
http://www.sciencedaily.com/releases/2011/04/110408101751.htm

Two novel geochemical techniques used to determine the temperature at which the mollusk shells were formed suggest that summertime Arctic temperatures during the early Pliocene epoch (3.5 million to 4 million years ago) may have been a staggering 18 to 28 degrees Fahrenheit warmer than today. And these ancient fossils, harvested from deep within the Arctic Circle, may have once lived in an environment in which the polar ice cap melted completely during the summer months.

"Our data from the early Pliocene, when carbon dioxide levels remained close to modern levels for thousands of years, may indicate how warm the planet will eventually become if carbon dioxide levels are stabilized at the current value of 400 parts per million," said Aradhna Tripati, a UCLA assistant professor in the department of Earth and space sciences and the department of atmospheric and oceanic sciences.
Printer Friendly | Permalink |  | Top
 
Dead_Parrot Donating Member (1000+ posts) Send PM | Profile | Ignore Mon Apr-11-11 03:28 PM
Response to Original message
8. Water is wet
Film at 11.
Printer Friendly | Permalink |  | Top
 
Nederland Donating Member (1000+ posts) Send PM | Profile | Ignore Mon Apr-11-11 04:02 PM
Response to Original message
9. Conclusions based on computer models are not credible
First of all, climate models have already demonstrated their shortcomings. The models evaluated in AR4 slightly under-estimated the rise of CO2, slightly over-estimated temperature rises, and significantly under-estimated ice cap melts rates. This outcome makes absolutely no sense. If CO2 rises were under-estimated, one would expect that observed temperature rises would exceed model predictions. Likewise, if temperature rises were over-estimated, one would expect ice cap melt to be less than predictions. Any comparison of computer model predictions to the post run observations brings one to the inescapable conclusion that we simply do not understand global climate well enough to model it accurately.

Second of all, even if the models had been spot on for the first five years (and they weren't), not enough time has passed to judge them fairly. You simply cannot assume that because a computer model predicted the first five years correctly that it will correctly predict the following ninety five years. Climate is complicated interaction of numerous non-linear forces that are just now beginning to be understood. Anyone who looks at the output of the computer models and thinks they represent an accurate view of what our future will look like is either a victim of embarrassing hubris or incredible ignorance.
Printer Friendly | Permalink |  | Top
 
OKIsItJustMe Donating Member (1000+ posts) Send PM | Profile | Ignore Mon Apr-11-11 05:03 PM
Response to Reply #9
10. That word “slightly”
Edited on Mon Apr-11-11 05:20 PM by OKIsItJustMe
I don’t think it means what you think it means.
http://www.merriam-webster.com/dictionary/slightly


c : deficient in weight, solidity, or importance : http://www.merriam-webster.com/dictionary/trivial">trivial <a slight movie>


http://books.nap.edu/openbook.php?record_id=12782&page=21

Uncertainty in Scientific Knowledge

From a philosophical perspective, science never proves anything—in the manner that mathematics or other formal logical systems prove things—because science is fundamentally based on observations. Any scientific theory is thus, in principle, subject to being refined or overturned by new observations. In practical terms, however, scientific uncertainties are not all the same. Some scientific conclusions or theories have been so thoroughly examined and tested, and supported by so many independent observations and results, that their likelihood of subsequently being found to be wrong is vanishingly small. Such conclusions and theories are then regarded as settled facts. This is the case for the conclusions that the Earth system is warming and that much of this warming is very likely due to human activities. In other cases, particularly for matters that are at the leading edge of active research, uncertainties may be substantial and important. In these cases, care must be taken not to draw stronger conclusions than warranted by the available evidence.

The characterization of uncertainty is thus an important part of the scientific enterprise. In some areas of inquiry, uncertainties can be quantified through a long sequence of repeated observations, trials, or model runs. For other areas, including many aspects of climate change research, precise quantification of uncertainty is not always possible due to the complexity or uniqueness of the system being studied. In these cases, researchers adopt various approaches to subjectively but rigorously assess their degree of confidence in particular results or theories, given available observations, analyses, and model results. These approaches include estimated uncertainty ranges (or error bars) for measured quantities and the estimated likelihood of a particular result having arisen by chance rather than as a result of the theory or phenomenon being tested. These scientific characterizations of uncertainty can be misunderstood, however, because for many people “uncertainty” means that little or nothing is known, whereas in scientific parlance uncertainty is a way of describing how precisely or how confidently something is known. To reduce such misunderstandings, scientists have developed explicit techniques for conveying the precision in a particular result or the confidence in a particular theory or conclusion to policy makers (see Box http://books.nap.edu/openbook.php?record_id=12782&page=23#p2001c3c59960023001">1.1).


http://www.climatescience.gov/Library/sap/sap3-1/final-report/default.htm

Climate Models

An Assessment of Strengths and Limitations

How uncertain are climate model results? In what ways has uncertainty in model-based simulation and prediction changed with increased knowledge about the climate system?

Chapter 1 provides an overview of improvement in models in both completeness and in the ability to simulate observed climate. Climate models are compared to observations of the mean climate in a multitude of ways, and their ability to simulate observed climate changes, particularly those of the past century, have been examined extensively. A discussion of metrics that may be used to evaluate model improvement over time is included at the end of Chapter 2, which cautions that no current model is superior to others in all respects, but rather that different models have differing strengths and weaknesses.

As discussed in Chapter 5, climate models developed in the United States and around the world show many consistent features in their simulations and projections for the future. Accurate simulation of present-day climatology for near-surface temperature and precipitation is necessary for most practical applications of climate modeling. The seasonal cycle and large- scale geographical variations of near-surface temperature are indeed well simulated in recent models, with typical correlations between models and observations of 95% or better.


http://www.democraticunderground.com/discuss/duboard.php?az=show_mesg&forum=115&topic_id=287249&mesg_id=287268
GEOPHYSICAL RESEARCH LETTERS, VOL. 38, L05805, 6 PP., 2011
doi:http://dx.doi.org/10.1029/2010GL046270">10.1029/2010GL046270

Carbon emission limits required to satisfy future representative concentration pathways of greenhouse gases


The response of the second-generation Canadian earth system model (CanESM2) to historical (1850–2005) and future (2006–2100) natural and anthropogenic forcing is assessed using the newly-developed representative concentration pathways (RCPs) of greenhouse gases (GHGs) and aerosols. Allowable emissions required to achieve the future atmospheric CO2 concentration pathways, are reported for the RCP 2.6, 4.5 and 8.5 scenarios. For the historical 1850–2005 period, cumulative land plus ocean carbon uptake and, consequently, cumulative diagnosed emissions compare well with observation-based estimates. The simulated historical carbon uptake is somewhat weaker for the ocean and stronger for the land relative to their observation-based estimates. The simulated historical warming of 0.9°C compares well with the observation-based estimate of 0.76 ± 0.19°C. The RCP 2.6, 4.5 and 8.5 scenarios respectively yield warmings of 1.4, 2.3, and 4.9°C and cumulative diagnosed fossil fuel emissions of 182, 643 and 1617 Pg C over the 2006–2100 period. The simulated warming of 2.3°C over the 1850–2100 period in the RCP 2.6 scenario, with the lowest concentration of GHGs, is slightly larger than the 2°C warming target set to avoid dangerous climate change by the 2009 UN Copenhagen Accord. The results of this study suggest that limiting warming to roughly 2°C by the end of this century is unlikely since it requires an immediate ramp down of emissions followed by ongoing carbon sequestration in the second half of this century.
Printer Friendly | Permalink |  | Top
 
Nederland Donating Member (1000+ posts) Send PM | Profile | Ignore Mon Apr-11-11 07:21 PM
Response to Reply #10
11. Not sure I get your point
Edited on Mon Apr-11-11 07:59 PM by Nederland
On Edit: I just noticed that your link "Climate Models: An Assessment of Strengths and Limitations" was published July 2008. Is that some sort of joke? Do you honestly believe that the accuracy of the IPCC AR4 2007 Report Climate Models can be accurately assessed in such a short time? Do you believe it is perfectly legitimate to look at a model whose computer runs took place in late 2006 and declare it "accurate" after only two years of observational data? Are you comfortable saying that because something looks pretty good after 2 years, we should spend hundreds of billions of dollars on the belief that they will be accurate for the next 98? If so, you have a rather low standard for what you call "proof".

Since you seem to have a problem with the words I chose to describe the differences between IPCC model predictions and subsequent observations, I'll just put up the graphs and let you qualify them anyway you want:

First CO2:


Actual CO2 is the solid line, IPCC prediction is the dashed line.

Next, temperature:


The blue line is NOAA observed temperatures, the pink line is the IPCC A1B prediction.

Finally sea level rise:


Annual observed sea level numbers in red, IPCC prediction are the dotted line.
Printer Friendly | Permalink |  | Top
 
OKIsItJustMe Donating Member (1000+ posts) Send PM | Profile | Ignore Tue Apr-12-11 08:50 AM
Response to Reply #11
12. My point regards your claim, "Conclusions based on computer models are not credible"
Edited on Tue Apr-12-11 09:35 AM by OKIsItJustMe
You point to "slight" (i.e.) trivial errors in the models, and claim that that makes them totally invalid.

The fact of the matter is, 100% accuracy is neither required, nor is it implied. Using the models, a range of predictions are made. Uncertainties are stated.

That’s the way science works.

For example, Newtonian physics was known to be wrong for more than a century before Einstein offered up a theory which successfully explained the motion of Mercury.
http://en.wikipedia.org/wiki/Gravitation#Newton.27s_theory_of_gravitation


A discrepancy in Mercury's orbit pointed out flaws in Newton's theory. By the end of the 19th century, it was known that its orbit showed slight perturbations that could not be accounted for entirely under Newton's theory, but all searches for another perturbing body (such as a planet orbiting the Sun even closer than Mercury) had been fruitless. The issue was resolved in 1915 by Albert Einstein's new theory of general relativity, which accounted for the small discrepancy in Mercury's orbit.

Although Newton's theory has been superseded, most modern non-relativistic gravitational calculations are still made using Newton's theory because it is a much simpler theory to work with than general relativity, and gives sufficiently accurate results for most applications involving sufficiently small masses, speeds and energies.


The Newtonian model is flawed. We've known that for 100's of years. It still works well enough to make useful predictions, for example, it was quite good enough to get astronauts safely to the Moon and back.

The Bohr model of the atom is also flawed. We know that.
http://en.wikipedia.org/wiki/Bohr_model


The Bohr model is a primitive model of the hydrogen atom. As a theory, it can be derived as a first-order approximation of the hydrogen atom using the broader and much more accurate quantum mechanics, and thus may be considered to be an obsolete scientific theory. However, because of its simplicity, and its correct results for selected systems (see below for application), the Bohr model is still commonly taught to introduce students to quantum mechanics, before moving on to the more accurate but more complex valence shell atom. A related model was originally proposed by Arthur Erich Haas in 1910, but was rejected. The quantum theory of the period between Planck's discovery of the quantum (1900) and the advent of a full-blown quantum mechanics (1925) is often referred to as the old quantum theory.


The advantage of these scientific models, which are known to be flawed is that they are simple, and good enough approximations to be useful.


One of the problems with Climate Models is the sheer complexity of the climate system. To model it absolutely perfectly would require a perfect mathematical model of the Earth, and calculation would become ah… “problematic.”

As a result, one of the reasons why climate models have improved over the http://celebrating200years.noaa.gov/breakthroughs/climate_model/welcome.html">past 40+ years is quite simply that computers are becoming more powerful. As computers become more powerful, it becomes practical to evaluate more complex climate models.

http://www.nsf.gov/news/news_summ.jsp?cntn_id=117513

Press Release 10-146

New Computer Model Advances Climate Change Research

Community Earth System Model to be used in next IPCC assessment

August 18, 2010

Scientists can now study climate change in far more detail with powerful new computer software released by the National Center for Atmospheric Research (NCAR) in Boulder, Colo.

The Community Earth System Model will be one of the primary climate models used for the next assessment by the Intergovernmental Panel on Climate Change (IPCC).

The CESM is the latest in a series of NCAR-based global models developed over the last 30 years. The models are jointly supported by the U.S. Department of Energy (DOE) and the National Science Foundation (NSF), which is NCAR's sponsor.

Scientists and engineers at NCAR, DOE laboratories, and several universities developed the CESM.

"The Community Earth System Model is yet another step toward representing improved physics and biogeochemistry in a coupled model," says Anjuli Bamzai, program director in NSF's Division of Atmospheric and Geospace Sciences, which funds NCAR.


"Thanks to its improved physics and expanded biogeochemistry, it gives us a better representation of the real world."

Climate scientists rely on computer models to better understand Earth's climate system because they cannot conduct large-scale experiments on the atmosphere itself.


Because climate models cover far longer periods than weather models, they cannot include as much detail. Thus, climate projections appear on regional to global scales rather than local scales.


Using the CESM, researchers can now simulate the interaction of marine ecosystems with greenhouse gases; the climatic influence of ozone, dust, and other atmospheric chemicals; the cycling of carbon through the atmosphere, oceans, and land surfaces; and the influence of greenhouse gases on the upper atmosphere.


These new models should give us even better predictions of the climate, however, the fact remains that the models we have are good enough to tell us the direction we’re headed in.
Printer Friendly | Permalink |  | Top
 
Nederland Donating Member (1000+ posts) Send PM | Profile | Ignore Tue Apr-12-11 11:40 AM
Response to Reply #12
14. Not sure you read my post carefully enough
Edited on Tue Apr-12-11 11:43 AM by Nederland
The point is not simply that the models are getting the magnitude of a few forcings slightly wrong, the point is that the models are getting the direction of a few forcings wrong. The fact that the models underestimated CO2 rise is in and of itself no big deal. What is a big deal is that the CO2 error does not line up with the direction of the temperature error. Since CO2 increases were underestimated, we should see temperature increases being underestimated as well. Instead, what we see is completely backwards--we see temperature increases being overstated. The sea level error is even worse. Since the models overestimated temperature increases, we should have seen an overestimation of sea level rise. Instead, what we see is again completely backwards, and by an even larger margin than the CO2-temperature mismatch. Sea level rise predictions weren't even close.

What this indicates is that the models still have some fundamental problems with the way all of the variables in climate interact. The mismatched direction of errors highlights the fact that a great deal of work still needs to be done before we can claim the models to be accurate enough to base policy decisions on.

More importantly, you completely ignore my point regarding the amount of time that has past since the model runs completed. Four or five years is simply not enough time to be able to express confidence in any model output, even if it were perfect, which it obviously wasn't.
Printer Friendly | Permalink |  | Top
 
OKIsItJustMe Donating Member (1000+ posts) Send PM | Profile | Ignore Tue Apr-12-11 01:58 PM
Response to Reply #14
15. No, I read it.
Remember that paper you dismissed because it was from 2008?
http://www.climatescience.gov/Library/sap/sap3-1/final-report/default.htm

The scientific viewpoints expressed still hold.

Here's another bit from 2008:
http://americasclimatechoices.org/climate_change_2008_final.pdf

Models help illuminate the many dimensions of climate change.

Climate models are important tools for understanding how different components of the climate system operate today, how they may have functioned differently in the past, and how the climate might evolve in the future in response to forcings from both natural processes and human activities. Climate models use mathematical equations to represent the climate system, first modeling each system component separately and then linking them together to simulate the full Earth system. These models are run on advanced supercomputers.

Since the late 1960s, when climate models were pioneered, their accuracy has increased as computing power and our understanding of the climate system have improved. Improving Effectiveness of U.S. Climate Modeling (2001) offered several recommendations for strengthening climate modeling capabilities in the United States. The report identified a shortfall in computing facilities and highly skilled technical workers devoted to climate modeling as two important problems. Several of the report’s recommendations have been adopted since it was published, but concerns remain about whether the United States is training enough people to work on climate change issues.


I think what you’re having trouble with is that you expect these climate models to be 100% accurate in the short term. That’s actually a pretty tall order. Believe it or not, the longer term is easier to predict.

For example, let‘s play with a pair of dice. I tell you, the odds are best you will roll a seven. You roll the dice, and they come up five. “Hah!” you say, “shows how much you know…” OK, so roll them 100 times, and let’s see what your results are.


You point to the models and say, “in the last few years, they went the wrong way! (shows how much those scientists know!)” Then, you wave your hand and dismiss all models, because these models aren’t as accurate as you would like in the short term.

So, tell me, how would you suggest we predict the future climate? Should we use chicken bones or some other form of divination? Or should we just wait a century and see what happens?
Printer Friendly | Permalink |  | Top
 
XemaSab Donating Member (1000+ posts) Send PM | Profile | Ignore Tue Apr-12-11 02:17 PM
Response to Reply #15
16. I'm not a fan of models myself
and in this instance, I think 1) it will take more time to refine the models than the time it will take to see, for example, when the arctic becomes ice-free, and 2) it's a complex system and I think properties and behaviors will emerge from a warmer world beyond just "hotter and drier" everywhere.

Printer Friendly | Permalink |  | Top
 
OKIsItJustMe Donating Member (1000+ posts) Send PM | Profile | Ignore Tue Apr-12-11 03:33 PM
Response to Reply #16
18. Well, that's what the models predict
i.e. "behaviors will emerge from a warmer world beyond just "hotter and drier" everywhere."

http://earthobservatory.nasa.gov/Features/Water/page3.php

The Water Cycle and Climate Change

Among the most serious Earth science and environmental policy issues confronting society are the potential changes in the Earth’s water cycle due to climate change. The science community now generally agrees that the Earth’s climate is undergoing changes in response to natural variability, including solar variability, and increasing concentrations of greenhouse gases and aerosols. Furthermore, agreement is widespread that these changes may profoundly affect atmospheric water vapor concentrations, clouds, precipitation patterns, and runoff and stream flow patterns.


For example, as the lower atmosphere becomes warmer, evaporation rates will increase, resulting in an increase in the amount of moisture circulating throughout the troposphere (lower atmosphere). An observed consequence of higher water vapor concentrations is the increased frequency of intense precipitation events, mainly over land areas. Furthermore, because of warmer temperatures, more precipitation is falling as rain rather than snow.


In parts of the Northern Hemisphere, an earlier arrival of spring-like conditions is leading to earlier peaks in snowmelt and resulting river flows. As a consequence, seasons with the highest water demand, typically summer and fall, are being impacted by a reduced availability of fresh water.


Warmer temperatures have led to increased drying of the land surface in some areas, with the effect of an increased incidence and severity of drought. The Palmer Drought Severity Index, which is a measure of soil moisture using precipitation measurements and rough estimates of changes in evaporation, has shown that from 1900 to 2002, the Sahel region of Africa has been experiencing harsher drought conditions. This same index also indicates an opposite trend in southern South America and the south central United States.


While the brief scenarios described above represent a small portion of the observed changes in the water cycle, it should be noted that many uncertainties remain in the prediction of future climate. These uncertainties derive from the sheer complexity of the climate system, insufficient and incomplete data sets, and inconsistent results given by current climate models. However, state of the art (but still incomplete and imperfect) climate models do consistently predict that precipitation will become more variable, with increased risks of drought and floods at different times and places.

Printer Friendly | Permalink |  | Top
 
Nederland Donating Member (1000+ posts) Send PM | Profile | Ignore Tue Apr-12-11 03:34 PM
Response to Reply #16
19. I would agree with this
It will take longer to validate the models in a scientific sense than it will take to know what we need to know.
Printer Friendly | Permalink |  | Top
 
OKIsItJustMe Donating Member (1000+ posts) Send PM | Profile | Ignore Tue Apr-12-11 04:01 PM
Response to Reply #19
21. When (in your estimation) will we know enough to act?
Do you need omniscience? Or is partial knowledge sufficient?

Are you the sort of person who addresses risks around your home when you identify them? Or do you prefer to wait until someone is actually injured or killed (thereby proving that the risk was real) before acting?
Printer Friendly | Permalink |  | Top
 
Nederland Donating Member (1000+ posts) Send PM | Profile | Ignore Tue Apr-12-11 05:37 PM
Response to Reply #21
22. Like I said, in 20 or 30 years
Even at that point you really only have partial knowledge, but you'd be much more certain than you are today. I don't think it is unreasonable to as for computer model that has been shown to be accurate over 20 or 30 years before spending hundreds of billions of dollars, do you?
Printer Friendly | Permalink |  | Top
 
OKIsItJustMe Donating Member (1000+ posts) Send PM | Profile | Ignore Wed Apr-13-11 12:27 PM
Response to Reply #22
32. OK, fair enough, we’ve waited 30 years. (Can we do something now?)
Edited on Wed Apr-13-11 12:44 PM by OKIsItJustMe
The Science is in:

http://books.nap.edu/catalog.php?record_id=12181

Carbon Dioxide and Climate: A Scientific Assessment

Report of an Ad Hoc Study Group on Carbon Dioxide and Climate

Woods Hole, Massachusetts

July 23–27, 1979

to the

Climate Research Board

Assembly of Mathematical and Physical Sciences

National Research Council


NATIONAL ACADEMY OF SCIENCES


Washington, D.C. 1979


1
Summary and Conclusions

We have examined the principal attempts to simulate the effects of increased atmospheric CO2 on climate. In doing so, we have limited our considerations to the direct climatic effects of steadily rising atmospheric concentrations of CO2 and have assumed a rate of CO2 increase that would lead to a doubling of airborne concentrations by some time in the first half of the twenty-first century. As indicated in http://books.nap.edu/openbook.php?record_id=12181&page=4#p200145cd9970004001">Chapter 2 of this report, such a rate is consistent with observations of CO2 increases in the recent past and with projections of its future sources and sinks. However, we have not examined anew the many uncertainties in these projections, such as their implicit assumptions with regard to the workings of the world economy and the role of the biosphere in the carbon cycle. These impose an uncertainty beyond that arising from our necessarily imperfect knowledge of the manifold and complex climatic system of the earth.

When it is assumed that the CO2 content of the atmosphere is doubled and statistical thermal equilibrium is achieved, the more realistic of the modeling efforts predict a global surface warming of between 2°C and 3.5°C, with greater increases at high latitudes. This range reflects both uncertainties in physical understanding and inaccuracies arising from the need to reduce the mathematical problem to one that can be handled by even the fastest available electronic computers. It is significant, however, that none of the model calculations predicts negligible warming.

The primary effect of an increase of CO2 is to cause more absorption of thermal radiation from the earth’s surface and thus to increase the air temperature in the troposphere. A strong positive feedback mechanism is the accompanying increase of moisture, which is an even more powerful absorber of terrestrial radiation. We have examined with care all known negative feedback mechanisms, such as increase in low or middle cloud amount, and have concluded that the oversimplifications and inaccuracies in the models are not likely to have vitiated the principal conclusion that there will be appreciable warming. The known negative feedback mechanisms can reduce the warming, but they do not appear to be so strong as the positive moisture feedback. We estimate the most probable global warming for a doubling of CO2 to be near 3°C with a probable error of ±1.5°C. Our estimate is based primarily on our review of a series of calculations with three-dimensional models of the global atmospheric circulation, which is summarized in http://books.nap.edu/openbook.php?record_id=12181&page=12#p200145cd9970012001">Chapter 4. We have also reviewed simpler models that appear to contain the main physical factors. These give qualitatively similar results.


We conclude that the predictions of CO2-induced climate changes made with the various models examined are basically consistent and mutually supporting. The differences in model results are relatively small and may be accounted for by differences in model characteristics and simplifying assumptions. Of course, we can never be sure that some badly estimated or totally overlooked effect may not vitiate our conclusions. We can only say that we have not been able to find such effects. If the CO2 concentration of the atmosphere is indeed doubled and remains so long enough for the atmosphere and the intermediate layers of the ocean to attain approximate thermal equilibrium, our best estimate is that changes in global temperature of the order of 3°C will occur and that these will be accompanied by significant changes in regional climatic patterns.

Printer Friendly | Permalink |  | Top
 
Nederland Donating Member (1000+ posts) Send PM | Profile | Ignore Tue Apr-12-11 03:20 PM
Response to Reply #15
17. Still ignoring the main point
Edited on Tue Apr-12-11 03:33 PM by Nederland
...which is that not enough time has passed to know how accurate the models are. My comments regarding how observations have already diverged from predictions are secondary to this. I agree that those divergences do not at this early stage prove anything definitive about the models. I merely pointed them out to show that things aren't looking too good. Yes, the data could turn around over the next few years and come back in line with model predictions, but that is precisely my point. Right or wrong, you have to wait a few more years to find out.

I like your example using dice:

For example, let‘s play with a pair of dice. I tell you, the odds are best you will roll a seven. You roll the dice, and they come up five. “Hah!” you say, “shows how much you know…” OK, so roll them 100 times, and let’s see what your results are.

I completely agree with this description. What you fail to realize is that the same logic applies when you are asserting a theory that is manifestly wrong. For example, let's say I'm claiming that if you roll a pair of dice, the odds are best you will roll a five. You roll the dice, and they come up five. “Hah!” I say, “see, I was right…”. But I'm not right, I just haven't rolled the dice enough times to show that my theory is actually wrong.

The point in both cases is that you need enough data points to prove the theory correct or incorrect. When it comes to evaluating the accuracy of climate models, we've only got five or six years of data--and that isn't nearly enough.

You ask me to suggest how I would predict the future climate. The answer is simple. Create a bunch of computer models that try to predict climate, and then wait twenty or thirty years to see if their predictions are accurate. If they are, only then can you possibly claim you've got something useful.

I suspect your response to this is something along the lines of "but we don't have 20 or 30 years!". Well, statistics and scientific method demand certain conditions be meet before declaring a theory or model to be "true" or "accurate", and the urgency of the issue doesn't change those conditions. If meeting those conditions takes 20 or 30 years that's just a reality we all have to live with.
Printer Friendly | Permalink |  | Top
 
OKIsItJustMe Donating Member (1000+ posts) Send PM | Profile | Ignore Tue Apr-12-11 03:48 PM
Response to Reply #17
20. That's right, if the models are anywhere close to accurate, we don't have 20 or 30 years
You know, it’s funny, the scientific community seems to feel they’re pretty accurate.

http://www.oar.noaa.gov/climate/t_modeling.html

Modeling Climate

What is climate and why do we model it?

Climate refers to the average of weather conditions. It varies on timescales ranging from seasonal to centennial. Fluctuations result naturally from interactions between the ocean, the atmosphere, the land, cryosphere (frozen portion of the Earth's surface), and changes in the Earth's energy balance resulting from volcanic eruptions and variations in the sun's intensity. Since the Industrial Revolution significant changes in radiative forcing (Earth's heat energy balance) have resulted from the build up of greenhouse gases and trace constituents. The impacts on the planet of these anthropogenically-induced or man-made changes to the energy budget have been detected and are projected to become increasingly more important during the next century.

Computer models of the coupled atmosphere-land surface-ocean-sea ice system are essential scientific tools for understanding and predicting natural and human-caused changes in Earth's climate.

How do we model climate?

Climate models are systems of differential equations derived from the basic laws of physics, fluid motion, and chemistry formulated to be solved on supercomputers. For the solution the planet is covered by a 3-dimensional grid
to which the basic equations are applied and evaluated. At each grid point, e.g. for the atmosphere, the motion of the air (winds), heat transfer (thermodynamics), radiation (solar and terrestrial), moisture content (relative humidity) and surface hydrology (precipitation, evaporation, snow melt and runoff) are calculated as well as the interactions of these processes among neighboring points. The computations are stepped forward in time from seasons to centuries depending on the study.

State-of-the-art climate models now include interactive representations of the ocean, the atmosphere, the land, hydrologic and cryospheric processes, terrestrial and oceanic carbon cycles, and atmospheric chemistry.

The accuracy of climate models is limited by grid resolution and our ability to describe the complicated atmospheric, oceanic, and chemical processes mathematically. Much of the research in OAR is directed at improving the representation of these processes. Despite some imperfections, models simulate remarkably well current climate and its variability. More capable supercomputers enable significant model improvements by allowing for more accurate representation of currently unresolved physics.


So, how about we treat them as if they are accurate. What’s the downside if they aren’t? Perhaps warming won't be quite as abrupt as they suggest.

Maybe it will be easier to slow the warming than we anticipate! (Wouldn't that be a pleasant surprise?)
Printer Friendly | Permalink |  | Top
 
Nederland Donating Member (1000+ posts) Send PM | Profile | Ignore Tue Apr-12-11 05:42 PM
Response to Reply #20
23. Response
You know, it’s funny, the scientific community seems to feel they’re pretty accurate.

No, honest scientists know we don't have enough data to render judgement yet. Honest scientists like RealClimate's Gavin Schmidt for example. He looks at Hansen's 1988 model, for which we have 22 years of observed data to compare to, and still will not say that it has been proven correct.

So, how about we treat them as if they are accurate. What’s the downside if they aren't?

Oh, I don't know. Spending hundreds of billions of dollars on a non-existence problem? :shrug:
Printer Friendly | Permalink |  | Top
 
Barrett808 Donating Member (1000+ posts) Send PM | Profile | Ignore Wed Apr-13-11 08:25 AM
Response to Reply #23
26. It's a gross misrepresentation to suggest that Gavin Schmidt thinks we don't have enough data
...to decide whether our understanding of radiative thermodynamics is good enough to render a judgment.

For example, here's Gavin in January 2011:

Finally, we update the Hansen et al (1988) comparisons. As stated last year, the Scenario B in that paper is running a little high compared with the actual forcings growth (by about 10%) (and high compared to A1B), and the old GISS model had a climate sensitivity that was a little higher (4.2ºC for a doubling of CO2) than the best estimate (~3ºC).

As before, it seems that the Hansen et al ‘B’ projection is likely running a little warm compared to the real world. Repeating the calculation from last year, assuming (again, a little recklessly) that the 27 yr trend scales linearly with the sensitivity and the forcing, we could use this mismatch to estimate a sensitivity for the real world. That would give us 4.2/(0.27*0.9) * 0.19=~ 3.3 ºC. And again, it’s interesting to note that the best estimate sensitivity deduced from this projection, is very close to what we think in any case. For reference, the trends in the AR4 models for the same period have a range 0.21+/-0.16 ºC/dec (95%).

So to conclude, global warming continues. Did you really think it wouldn’t?

2010 updates to model-data comparisons
Printer Friendly | Permalink |  | Top
 
Nederland Donating Member (1000+ posts) Send PM | Profile | Ignore Wed Apr-13-11 09:54 AM
Response to Reply #26
27. No it is not
In 2007, when the Hansen model was 19 years old, Gavin wrote this:

The bottom line? Scenario B is pretty close and certainly well within the error estimates of the real world changes. And if you factor in the 5 to 10% overestimate of the forcings in a simple way, Scenario B would be right in the middle of the observed trends. It is certainly close enough to provide confidence that the model is capable of matching the global mean temperature rise!

But can we say that this proves the model is correct? Not quite. Look at the difference between Scenario B and C. Despite the large difference in forcings in the later years, the long term trend over that same period is similar. The implication is that over a short period, the weather noise can mask significant differences in the forced component. This version of the model had a climate sensitivity was around 4 deg C for a doubling of CO2. This is a little higher than what would be our best guess (~3 deg C) based on observations, but is within the standard range (2 to 4.5 deg C). Is this 20 year trend sufficient to determine whether the model sensitivity was too high? No. Given the noise level, a trend 75% as large, would still be within the error bars of the observation (i.e. 0.18+/-0.05), assuming the transient trend would scale linearly. Maybe with another 10 years of data, this distinction will be possible. However, a model with a very low sensitivity, say 1 deg C, would have fallen well below the observed trends.


And so with nearly 19 years of data accumulated to judge against, and the model admittedly doing pretty well, Gavin is unwilling to say the model has been proven correct. Do you really think he would be willing to say the same of AR4 models that have only 4 or 5 years of observations behind them? Please...

http://www.realclimate.org/index.php/archives/2007/05/hansens-1988-projections/
Printer Friendly | Permalink |  | Top
 
Viking12 Donating Member (1000+ posts) Send PM | Profile | Ignore Wed Apr-13-11 10:40 AM
Response to Reply #27
30. So the most recent analysis with the most data is the less useful analysis?
Edited on Wed Apr-13-11 10:41 AM by Viking12
moron.
Printer Friendly | Permalink |  | Top
 
Nederland Donating Member (1000+ posts) Send PM | Profile | Ignore Thu Apr-14-11 12:00 AM
Response to Reply #30
34. Which model are you talking about?
Hansen's or models referenced in the OP?

The model referenced by the OP have been around less than a year. Do you think a model can be validated with less than a year of observational data?
Printer Friendly | Permalink |  | Top
 
Barrett808 Donating Member (1000+ posts) Send PM | Profile | Ignore Wed Apr-13-11 12:19 PM
Response to Reply #27
31. Gavin: "So to conclude, global warming continues. Did you really think it wouldn’t?"
That's pretty unequivocal.
Printer Friendly | Permalink |  | Top
 
Nederland Donating Member (1000+ posts) Send PM | Profile | Ignore Wed Apr-13-11 11:54 PM
Response to Reply #31
33. Yes it is unequivocal
The problem is, the question is not whether the world is getting warmer. The question is, what is the rate of warming and will it continue to get warmer for the next 90 years.
Printer Friendly | Permalink |  | Top
 
Barrett808 Donating Member (1000+ posts) Send PM | Profile | Ignore Fri Apr-15-11 09:31 AM
Response to Reply #33
40. Why would Earth not continue to warm?
All of the models predict warming as the CO2 drive increases; so do the basic radiative thermodynamics. Also, similar models and physics correctly predict the temperatures of various planets, including those with exotic atmospheres, such as Titan.

Climate science is successful and mature, and the results are robust. Earth will continue to warm for the next 90 years, and well beyond.
Printer Friendly | Permalink |  | Top
 
Nederland Donating Member (1000+ posts) Send PM | Profile | Ignore Fri Apr-15-11 11:00 AM
Response to Reply #40
44. You tell me
You say climate science is successful and mature, and the results are robust. What is your evidence of that? As I look at the data, all I can see is that we do not understand climate nearly as well as many people think we do. Let's look at the observed rate of warming using different time frames and different temperature records:


As you can see, if you are only looking at the last ten years, the rate of warming was negative (the world actually got cooler) for three of the records, and pretty close to zero for the other two. Why did this happen? You tell me, because I have no idea. The temperature record shows global warming rates flat or declining for the periods 1880-1910, 1950-1970, and 2000-2010, even though during those last two CO2 was rising. Why? Again, you tell me, because I have no idea. The point is that CO2 is evidently not the only factor involved here, and we do not understand climate nearly well enough to predict it over the long term.

That being said, I do believe that the world will continue to warm over the next 100 years. What I am not sure of is what the rate of that warming will be. At this point all we can say is that the current rate of warming is much less than what models like the CCCma model in the OP predict. That model predict warming around 4 degrees over the next 100 years, and the rate of that increase is pretty close to linear. If we have a model that is predicting warming of 0.3-0.4 degrees per decade, but the observed rate is much less, why should we believe that model?
Printer Friendly | Permalink |  | Top
 
OKIsItJustMe Donating Member (1000+ posts) Send PM | Profile | Ignore Fri Apr-15-11 11:31 AM
Response to Reply #44
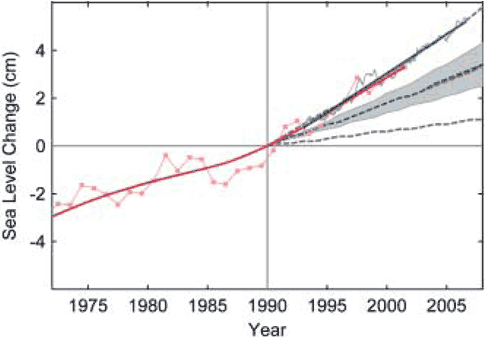
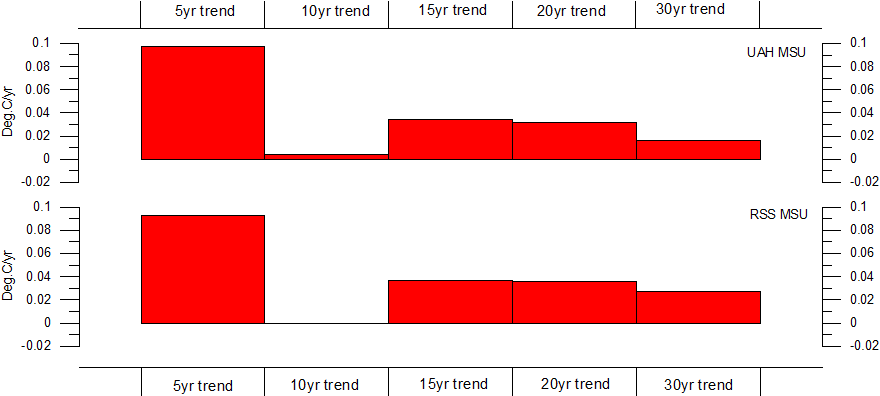
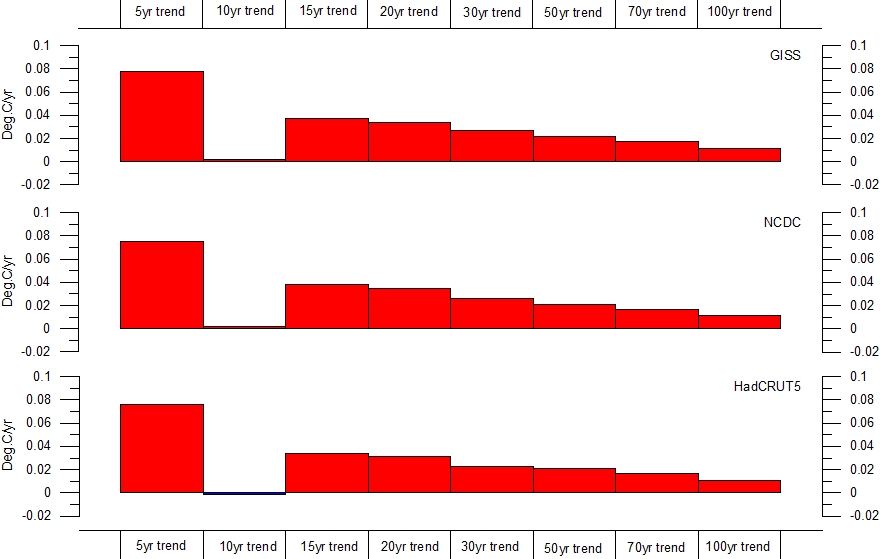
48. “Interesting data” but misleading
Edited on Fri Apr-15-11 11:40 AM by OKIsItJustMe
It results from "cherry-picking" the data.

Check 1998 vs 2008. Hey! Temperatures went down!


OK, now check 2000 vs 2010.

One more time, don’t look at the short term, look at the trend.


http://www.democraticunderground.com/discuss/duboard.php?az=show_mesg&forum=115&topic_id=287249&mesg_id=287577
Printer Friendly | Permalink |  | Top
 
Nederland Donating Member (1000+ posts) Send PM | Profile | Ignore Fri Apr-15-11 08:18 PM
Response to Reply #48
56. Did you even look at the graph captions?
Edited on Fri Apr-15-11 08:22 PM by Nederland
One more time, don’t look at the short term, look at the trend.

I posted a graph showing ALL the trends, ranging from 5 years to 100 years. How in the world can you accuse me of not looking the trend? The simple fact is that all of the trends, regardless of what time period you pick, are much lower than the trend predicted by the model in the OP.
Printer Friendly | Permalink |  | Top
 
Barrett808 Donating Member (1000+ posts) Send PM | Profile | Ignore Sat Apr-16-11 10:26 AM
Response to Reply #56
65. "Trends" with less than 30 years of annual data are noise. n/t
Printer Friendly | Permalink |  | Top
 
OKIsItJustMe Donating Member (1000+ posts) Send PM | Profile | Ignore Sat Apr-16-11 02:27 PM
Response to Reply #56
72. Yes I did
They don't even say what years were being compared. However, the downward 10 year trend makes it easy to see where the data was cherry-picked from.

Try drawing those bars relative to 2010 and see what you get.
Printer Friendly | Permalink |  | Top
 
Barrett808 Donating Member (1000+ posts) Send PM | Profile | Ignore Fri Apr-15-11 11:49 AM
Response to Reply #44
49. You need at least 20-30 years of annual data to infer a significant trend. Here's why:
If it is meaningful to talk about climate as opposed to weather, there has to be a time span over which our result for describing climate does not depend much on how long a time span we choose. For average climate temperature, we found 20-30 years as the appropriate time span. ...

Figure 1 shows the trends for all years (remember I'm lopping off the first 31 and last 31 from the NCDC record) that I computed trends for, by all 3 methods, in terms of the length of data record used. So at 36 (months) we see a range in the computed trends between +15 C/century and -15 C/century. These are enormous values compared to what we think of for climate change. If I wanted to give you a wrong impression about climate, then, I could use such short records. The range declines as we take longer periods. And then flattens out for trend periods of 252-372 months (21-31 years -- remember I took only odd averaging periods). In this part of the display, the range is about +1.5 C/century to -1.5 C/century -- and it is independently of how long an average I took. This, then, supports that a) there is such a thing as a climate temperature trend and b) that you need 21-31 years to find it (we can round to 20-30, given how 19 years is close to 21 also, we expect 20 even to be so as well).

Results on deciding trends
Printer Friendly | Permalink |  | Top
 
OKIsItJustMe Donating Member (1000+ posts) Send PM | Profile | Ignore Fri Apr-15-11 11:56 AM
Response to Reply #49
50. I question if even that is enough
Consider the 30 year period starting in 1942. An observer looking at that record in the 1970's might be concerned about “http://en.wikipedia.org/wiki/Global_cooling">Global Cooling.”

Printer Friendly | Permalink |  | Top
 
Nederland Donating Member (1000+ posts) Send PM | Profile | Ignore Fri Apr-15-11 08:25 PM
Response to Reply #50
57. Ok, how about we look at the 100 year tend? (nt)
Printer Friendly | Permalink |  | Top
 
Barrett808 Donating Member (1000+ posts) Send PM | Profile | Ignore Sat Apr-16-11 11:01 AM
Response to Reply #57
66. Here ya go, straight from NASA:


Except for a leveling off between the 1940s and 1970s, the surface temperature of our planet has increased since 1880. The last decade has seen global temperatures rise to the highest levels ever recorded. This graph illustrates the change in global surface temperature relative to 1951-1980 average temperatures. As shown by the red line, long-term trends are more apparent when temperatures are averaged over a 5-year period. The green error bars represent the uncertainty on measurements.

In 2010, global temperatures continued to rise. A new analysis from the Goddard Institute for Space Studies shows that 2010 tied with 2005 as the warmest year on record, and was part of the warmest decade on record. Credit: NASA GISS.

NASA research finds 2010 tied for warmest year on record

Printer Friendly | Permalink |  | Top
 
Nederland Donating Member (1000+ posts) Send PM | Profile | Ignore Sat Apr-16-11 04:02 PM
Response to Reply #66
75. What exactly is your point?
Edited on Sat Apr-16-11 04:10 PM by Nederland
First of all, that is not the 100 year trend. That is the temperature record for the last The 130 years with a 5 year running trend superimposed on it. Second of all, the information in that graph no different from any of the numbers in my post #44. So what exactly do you think you have proven here? Or perhaps you are admitting that I'm right...?

BTW, stretching the Y-axis out like that might fool some people, but not anybody familiar with the numbers...
Printer Friendly | Permalink |  | Top
 
OKIsItJustMe Donating Member (1000+ posts) Send PM | Profile | Ignore Wed Apr-13-11 10:10 AM
Response to Reply #23
28. "No, honest scientists know we don't have enough data to render judgement yet."
Edited on Wed Apr-13-11 10:12 AM by OKIsItJustMe
Let me revise that.

No honest scientists know believe we don't have enough data to render judgement yet.


http://americasclimatechoices.org/study-video.shtml


http://books.nap.edu/openbook.php?record_id=12782&page=20

SCIENTIFIC LEARNING ABOUT CLIMATE CHANGE

Climate science, like all science, is a process of collective learning that proceeds through the accumulation of data; the formulation, testing, and refinement of hypotheses; the construction of theories and models to synthesize understanding and generate new predictions; and the testing of hypotheses, theories, and models through experiments or other observations. Scientific knowledge builds over time as theories are refined and expanded and as new observations and data confirm or refute the predictions of current theories and models. Confidence in a theory grows if it survives this rigorous testing process, if multiple lines of evidence lead to the same conclusion, or if competing explanations can be ruled out.

In the case of climate science, this process of learning extends back more than 150 years, to mid-19th-century attempts to explain what caused the ice ages, which had only recently been discovered. Several hypotheses were proposed to explain how thick blankets of ice could have once covered much of the Northern Hemisphere, including changes in solar radiation, atmospheric composition, the placement of mountain ranges, and volcanic activity. These and other ideas were tested and debated by the scientific community, eventually leading to an understanding (discussed in detail in http://books.nap.edu/openbook.php?record_id=12782&page=183#p2001c3c59970183001">Chapter 6) that ice ages are initiated by small recurring variations in Earth’s orbit around the Sun. This early scientific interest in climate eventually led scientists working in the late 19th century to recognize that carbon dioxide (CO2) and other GHGs have a profound effect on the Earth’s temperature. A Swedish scientist named Svante Arrhenius was the first to hypothesize that the burning of fossil fuels, which releases CO2, would eventually lead to global warming. This was the beginning of a more than 100-year history of ever more careful measurements and calculations to pin down exactly how GHG emissions and other factors influence Earth’s climate (Weart, 2008).

Progress in scientific understanding, of course, does not proceed in a simple straight line. For example, calculations performed during the first decades of the 20th century, before the behavior of GHGs in the atmosphere was understood in detail, suggested that the amount of warming from elevated CO2 levels would be small. More precise experiments and observations in the mid-20th century showed that this was not the case, and that increases in CO2 or other GHGs could indeed cause significant warming. Similarly, a scientific debate in the 1970s briefly considered the possibility that human emissions of aerosols—small particles that reflect sunlight back to space—might lead to a long-term cooling of the Earth’s surface. Although prominently reported in a few news magazines at the time, this speculation did not gain widespread scientific acceptance and was soon overtaken by new evidence and refined calculations showing that warming from emissions of CO2 and other GHGs represented a larger long-term effect on climate.

Thus, scientists have understood for a long time that the basic principles of chemistry and physics predict that burning fossil fuels will lead to increases in the Earth’s average surface temperature. Decades of observations and research have tested, refined, and extended that understanding, for example, by identifying other factors that influence climate, such as changes in land use, and by identifying modes of natural variability that modulate the long-term warming trend. Detailed process studies and models of the climate system have also allowed scientists to project future climate changes. These projections are based on scenarios of future GHG emissions from energy use and other human activities, each of which represents a different set of choices that societies around the world might make. Finally, research across a broad range of scientific disciplines has improved our understanding of how the climate system interacts with other environmental systems and with human systems, including water resources, agricultural systems, ecosystems, and built environments.


http://books.nap.edu/openbook.php?record_id=12785&page=15#
Climate change, driven by the increasing concentration of greenhouse gases (GHGs) in the atmosphere, poses serious, wide-ranging threats to human societies and natural ecosystems around the world. While many uncertainties remain regarding the exact nature and severity of future impacts, the need for action seems clear. In the legislation that initiated our assessment of America’s climate choices, Congress directed the National Research Council to “investigate and study the serious and sweeping issues relating to global climate change and make recommendations regarding the steps that must be taken and what strategies must be adopted in response to global climate change.” As part of the response to this request, the America’s Climate Choices Panel on Limiting the Magnitude of Future Climate Change was charged to “describe, analyze, and assess strategies for reducing the net future human influence on climate, including both technology and policy options, focusing on actions to reduce domestic greenhouse gas (GHG) emissions and other human drivers of climate change, but also considering the international dimensions of climate stabilization” (see full statement of task in http://books.nap.edu/openbook.php?record_id=12785&page=243#p2001c3c39970243001">Appendix B). In other words, this report examines the questions, “What are the most effective options to help reduce GHG emissions or enhance GHG sinks?” and “What are the policies that will help drive the development and deployment of these options?”


http://www.nap.edu/catalog.php?record_id=12785


Because policy that limits climate change is highly complex and involves a wide array of political and ethical considerations, scientific analysis does not always point to unequivocal answers. We offer specific recommendations in cases where research clearly shows that certain strategies and policy options are particularly effective; but in other cases, we simply discuss the range of possible choices available to decision makers. On the broadest level, we conclude that the United States needs the following:
  • Prompt and sustained strategies to reduce GHG emissions.
    There is a need for policy responses to promote the technological and behavioral changes necessary for making substantial near-term GHG emission reductions. There is also a need to aggressively promote research, development, and deployment of new technologies, both to enhance our chances of making the needed emissions reductions and to reduce the costs of doing so.

  • An inclusive national framework for instituting response strategies and policies.
    National policies for limiting climate change are implemented through the actions of private industry, governments at all levels, and millions of households and individuals. The essential role of the federal government is to put in place an overarching, national policy framework designed to ensure that all of these actors are furthering the shared national goal of emissions reductions. In addition, a national policy framework that both generates and is underpinned by international cooperation is crucial if the risks of global climate change are to be substantially curtailed.

  • Adaptable means for managing policy responses.
    It is inevitable that policies put in place now will need to be modified in the future as new scientific information emerges, providing new insights and understanding of the climate problem. Even well-conceived policies may experience unanticipated difficulties, while others may yield unexpectedly high levels of success. Moreover, the degree, rate, and direction of technological innovation will alter the array of response options available and the costs of emissions abatement. Quickly and nimbly responding to new scientific information, the state of technology, and evidence of policy effectiveness will be essential to successfully managing climate risks over the course of decades.
Printer Friendly | Permalink |  | Top
 
Nederland Donating Member (1000+ posts) Send PM | Profile | Ignore Thu Apr-14-11 12:03 AM
Response to Reply #28
35. Let's cut to the chase shall we?
The models in the OP are less than a year old. Do you believe it possible to validate a model with less than a year of observational data?

Don't beat around the bush or avoid the question. Just give me a straight yes or no answer.
Printer Friendly | Permalink |  | Top
 
OKIsItJustMe Donating Member (1000+ posts) Send PM | Profile | Ignore Thu Apr-14-11 07:08 PM
Response to Reply #35
36. CanESM2 is the latest version of CanESM which is based on previous models dating back 30 years
Edited on Thu Apr-14-11 07:23 PM by OKIsItJustMe
http://www.google.com/url?sa=t&source=web&cd=6&sqi=2&ved=0CDgQFjAF&url=https%3A%2F%2Fwww1.cmos.ca%2FAmsoft%2520Web%2520Data%2Fupload%2Fabstracts125%2F4091archive.html&rct=j&q=CanESM%20canadian%20climate&ei=YI2nTeGxJ46_gQfC9-HzBQ&usg=AFQjCNERw-a-JsCQGw93unmhCK7Q__T8RQ&cad=rja

The Second Generation Canadian Earth System Model (CanESM2): An Overview

Gregory Flato
Canadian Centre for Climate Modelling and Analysis
Contact: greg.flato@ec.gc.ca

An Earth System model goes beyond a conventional coupled global climate model by including representations of important biogeochemical processes that feedback directly on the physical climate. Of particular note are representations of the carbon and sulphur cycles. The former directly affects the extent to which carbon dioxide, emitted by human activities, is taken up by the land and ocean, and hence affects the amount remaining in the atmosphere and altering the radiative budget. The latter directly and indirectly affects the energy budget by altering the amount of sulphate aerosols in the atmosphere. This presentation will provide an overview of CanESM2 and a survey of results obtained from both historical simulations and future climate projections. In particular, we will show results comparing historical simulations to observations, allowing evaluation of model performance, and will discuss how the future projections differ from those made with earlier climate models. The development of CanESM2 represents the culmination of many years of work by a large group of scientists at CCCma, along with university colleagues who have been involved in various research networks. The results from this model constitute the core Canadian contribution to the multi-model ensemble that will underpin the IPCC Fifth Assessment Report. …


http://ipy-osc.no/abstract/381228


The Canadian Earth System Model (CanESM) is based on the CCCma Canadian global coupled Climate Model (CanCM3.5) and includes dynamic models of the ocean and terrestrial carbon cycle. The current version CanESM2.0 contains a simple NPZD-Chl ecosystem model plus carbon chemistry …


http://www.ec.gc.ca/ccmac-cccma/default.asp?lang=En&n=4A642EDE-1
http://www.ec.gc.ca/ccmac-cccma/default.asp?lang=En&n=3E54E9D8-1

The First Generation Atmospheric General Circulation Model

Canadian Centre for Climate Modelling and Analysis

The first generation atmospheric general circulation model (AGCM1) is no longer used at CCCma. The following details about the model are listed here for historical purposes and to help the reader understand how our various models have evolved from their predecessors.

1. Model features

The first generation atmospheric general circulation model evolved from an earlier 5–layer version discussed by Boer and McFarlane (1979). The spectral formulation in the CGCM makes use of a truncated expansion in spherical harmonics to represent model variables in the horizontal.

Other features of the numerics include semi–implicit time–stepping (Robert et al., 1972) with a weak time filter (Asselin, 1972). The basic structure of the model is similar to that of the spectral forecast model of Daley et al. (1976), although some improvements have been made in the procedure for implementing the spectral algorithms and, of course, important additional physical processes have been included.

The equation governing horizontal motion are written in terms of vorticity and divergence of the horizontal wind. The remaining basic prognostic equations include the themodynamic equation written in terms of a function of geopotential height, the moisture equation written in terms of dew–point depression, and the surface pressure equation. Temperature is determined diagnostically from the geopotential via the hydrostatic equation, and the vertical motion variable is determined from the mass continuity equatiovia the hydrostatic equation, and the vertical motion variable is determined from the mass continuity equation.


http://www.ec.gc.ca/ccmac-cccma/default.asp?lang=En&n=E9805194-1

The Second Generation Atmospheric General Circulation Model

Canadian Centre for Climate Modelling and Analysis

1. The atmospheric model

The basic features of the atmospheric and land surface parts of AGCM2 are similar to those of the earlier version (The First Generation Atmospheric General Circulation Model, described in some detail in Boer et al., 1984). In particular, the spectral formulation for representation of the horizontal variation of prognostic variables is retained. Important differences between the models are briefly described in the following subsections.


http://www.ec.gc.ca/ccmac-cccma/default.asp?lang=En&n=89039701-1

The Third Generation Atmospheric General Circulation Model

Canadian Centre for Climate Modelling and Analysis

The third-generation AGCM(McFarlane et al. 2005, Scinocca et al. 2008) shares many basic features with the CCC second generation model The Second Generation Atmospheric General Circulation Model(McFarlane et al. 1992). As in AGCM2, the spectral transform method is used to represent the horizontal spatial structure of the main prognostic variables while the vertical representation is in terms of rectangular finite elements defined for a hybrid vertical coordinate as described by Laprise and Girard (1990).

The spectral representation currently used in AGCM3 corresponds to a higher horizontal resolution than that used in AGCM2, being comprised of a 47 wave triangularly truncated (T47) spherical harmonic expansion. The vertical domain of AGCM3 is deeper than in AGCM2 and the vertical resolution is also higher. The third-generation model domain extends from the surface to the stratopause region (1hPa, approximately 50km above the surface).This region is spanned by 32 layers. The mid point of the lowest layer is approximately 50 meters above the surface at sea level. Layer depths increase monotonically with height from approximately 100 meters at the surface to 3km in the lower stratosphere.

The treatment of many of the parameterized physical processes in the third-generation model is qualitatively similar to AGCM2. However, the are some key features that are new to the third generation model. These include the introduction of CLASS, a new module for treatment of the land surface processes (Verseghy et al, 1992). This new land surface scheme is considerably more comprehensive than the simple single soil layer scheme used in AGCM2. In particular, the new scheme includes 3 soil layers, a snow layer where applicable, and a vegetative canopy treatment. Both liquid and frozen forms of soil moisture are carried as prognostic variables. Soil surface properties such as surface roughness heights for heat and momentum (which differ from each other in general), and surface albedos are taken to be functions of the soil and vegetation types and soil moisture conditions within a given grid volume.


They’ve been refining models for over 30 years. They’re getting more and more precise, but they aren’t changing their basic results.

http://www.democraticunderground.com/discuss/duboard.php?az=show_mesg&forum=115&topic_id=287249&mesg_id=287604

Can we do something now!?
Printer Friendly | Permalink |  | Top
 
Nederland Donating Member (1000+ posts) Send PM | Profile | Ignore Fri Apr-15-11 01:27 AM
Response to Reply #36
37. You are using the wrong criteria
They’ve been refining models for over 30 years. They’re getting more and more precise...

The fact that the models are getting more and more precise is irrelevant. The real question is whether the models are accurate. The unfortunate truth is that you have no way of knowing if the new version of the model is accurate until some time passes and you can compare predicted conditions to observed.
Printer Friendly | Permalink |  | Top
 
OKIsItJustMe Donating Member (1000+ posts) Send PM | Profile | Ignore Fri Apr-15-11 09:32 AM
Response to Reply #37
41. I guess we need to define accurate
Have they led to any conclusions which have been contradicted?

The models have called for increasing temperature for 30 years. Have temperatures been dropping? (And please, let’s not talk about individual years.)
Printer Friendly | Permalink |  | Top
 
Nederland Donating Member (1000+ posts) Send PM | Profile | Ignore Fri Apr-15-11 10:10 AM
Response to Reply #41
42. Excellent suggestion
Edited on Fri Apr-15-11 10:11 AM by Nederland
We do need to define accurate. You point out that the models have called for increasing temperature for 30 years, and ask if temperatures been dropping. The answer is no, temperatures have not been dropping. However, you need to acknowledge that the magnitude of warming is the key question here. As I have said numerous times before, no serious and honest scientist denies that the world is getting warmer and that CO2 is one of the causes. That being said, it is foolish claim that there is a consensus on the magnitude of the warming we will see over the next 100 years. Even within the AR4 report itself there are models with wildly differing predictions:


BTW, as you can see the Canadian model (CCCma) referred to in the OP is one of those on the higher end of projections, and therefore also one of those that has done the worst in predicting the last 10 years.

Why does it matter that the models are all so different? It matters because the steps that we need to take to address the problem vary a great deal, even with relatively small differences. If the warming we will see in the next 100 years is 4 or 5 degrees, any talk of reducing CO2 emmissions is pointless because it won't make much of a difference. If the warming we will see in the next 100 years is 2 or 3 degrees, reducing CO2 emmissions is a sensible discussion. If the warming we will see in the next 100 years is around 1 degree, reducing CO2 emmissions is probably not necessary because the problem is not really that serious.

There in lies the rub for policy makers. The models do not provide the accuracy you need to know what the correct path of action is. The models need to be accurate to something between 0.05 - 0.08 degrees (+/-) per decade in order to be useful. They aren't even close to that.
Printer Friendly | Permalink |  | Top
 
OKIsItJustMe Donating Member (1000+ posts) Send PM | Profile | Ignore Fri Apr-15-11 11:09 AM
Response to Reply #42
46. "Why does it matter that the models are all so different?"


Why does it matter that the models are all so different? It matters because the steps that we need to take to address the problem vary a great deal, even with relatively small differences. …


I wish that were true. You see, we’re having difficulty getting people to take the steps that are necessary to respond appropriately to address even the most “optimistic” models. How about we start there?


http://dx.doi.org/10.1029/2010GL046270
The response of the second-generation Canadian earth system model (CanESM2) to historical (1850–2005) and future (2006–2100) natural and anthropogenic forcing is assessed using the newly-developed representative concentration pathways (RCPs) of greenhouse gases (GHGs) and aerosols. Allowable emissions required to achieve the future atmospheric CO2 concentration pathways, are reported for the RCP 2.6, 4.5 and 8.5 scenarios. For the historical 1850–2005 period, cumulative land plus ocean carbon uptake and, consequently, cumulative diagnosed emissions compare well with observation-based estimates. The simulated historical carbon uptake is somewhat weaker for the ocean and stronger for the land relative to their observation-based estimates. The simulated historical warming of 0.9°C compares well with the observation-based estimate of 0.76 ± 0.19°C. The RCP 2.6, 4.5 and 8.5 scenarios respectively yield warmings of 1.4, 2.3, and 4.9°C and cumulative diagnosed fossil fuel emissions of 182, 643 and 1617 Pg C over the 2006–2100 period. The simulated warming of 2.3°C over the 1850–2100 period in the RCP 2.6 scenario, with the lowest concentration of GHGs, is slightly larger than the 2°C warming target set to avoid dangerous climate change by the 2009 UN Copenhagen Accord. The results of this study suggest that limiting warming to roughly 2°C by the end of this century is unlikely since it requires an immediate ramp down of emissions followed by ongoing carbon sequestration in the second half of this century.
Printer Friendly | Permalink |  | Top
 
Nederland Donating Member (1000+ posts) Send PM | Profile | Ignore Fri Apr-15-11 08:08 PM
Response to Reply #46
54. It IS true
The actions you should take differ depending on how much warming there will be.
Printer Friendly | Permalink |  | Top
 
OKIsItJustMe Donating Member (1000+ posts) Send PM | Profile | Ignore Sat Apr-16-11 02:11 PM
Response to Reply #54
70. Of course it is
At a minimum, we should be responding to the best case scenario (i.e. roughly 2°C of warming) and you’re resisting doing that on the grounds that we don’t have enough information yet.

What I'm saying is, can we agree that there we’re facing 2°C (or more) of warming, unless we act now? It will take a while to ramp up a response to even that best case scenario.

Then, if/when we find that our actions are not sufficient, we can ramp them up still further.

However, if we wait to see whether it’s 2°C or 10°C that we’re facing before we start to address it, the challenge will be greater or perhaps impossible, even in the best case scenario.
Printer Friendly | Permalink |  | Top
 
Viking12 Donating Member (1000+ posts) Send PM | Profile | Ignore Fri Apr-15-11 01:24 PM
Response to Reply #42
51. Absolute nonsense.
It's not the climate models that are useless. You're applying a cost-benefit model of decision-making to a problem that doesn't fit that model. Moreover, within your broken decision making model there are implicit assumptions based on worthless economic models.
Printer Friendly | Permalink |  | Top
 
Nederland Donating Member (1000+ posts) Send PM | Profile | Ignore Fri Apr-15-11 08:10 PM
Response to Reply #51
55. Absolute nonsense
The actions you should take differ depending on how much warming there will be. It has nothing to do with cost-benefit analysis.
Printer Friendly | Permalink |  | Top
 
Viking12 Donating Member (1000+ posts) Send PM | Profile | Ignore Fri Apr-15-11 09:13 PM
Response to Reply #55
58. So you don't even have a clue about the position you defend so vigorously?
Printer Friendly | Permalink |  | Top
 
Nederland Donating Member (1000+ posts) Send PM | Profile | Ignore Fri Apr-15-11 10:08 PM
Response to Reply #58
60. I certainly have more of a clue than you
You apparently think the amount of warming we will experience irrelevant.
Printer Friendly | Permalink |  | Top
 
Nederland Donating Member (1000+ posts) Send PM | Profile | Ignore Fri Apr-15-11 02:52 AM
Response to Reply #36
39. So let's look at how accurate those Candian models have been
I found this on Wikipedia:


Obviously the Canadian model is not very good when compared to actual observed temperatures. Given that this graph cuts off at 2000, just where observed temperatures start to level off, its a good bet the model looks even worse if you included the years 2000-2010. However, I could be wrong. If you can find a plot of CCC model predictions compared to observed data all the way through 2010 I would be interested.
Printer Friendly | Permalink |  | Top
 
OKIsItJustMe Donating Member (1000+ posts) Send PM | Profile | Ignore Fri Apr-15-11 10:56 AM
Response to Reply #39
43. I guess I don't see some horrible inaccuracy there.
Edited on Fri Apr-15-11 11:25 AM by OKIsItJustMe
For a time in the 1940's the observed temperatures rose higher than the Canadian model would have predicted. How about if you look at the trend?

Seriously, looking at individual years isn't terribly helpful. The long-term trend really is what you should be looking at.

Here's a recent journal article on the difficulties with even giving "decadal" predictions:

http://journals.ametsoc.org/doi/pdf/10.1175/2009BAMS2778.1


The prospect of decadal prediction and its recognized importance has led, in part, to the initiation, in several countries, of climate services intended to bridge the gap between the seasonal-to-interannual (SI) climate information provided by the National Meteorological and Hydrological Services and the broad-scale, longer-duration horizon information considered by the Intergovernmental Panel on Climate Change (IPCC) assessments. In the United States, the National Oceanic and Atmospheric Administration (NOAA), in partnership with other agencies, is discussing formation of a National Climate Service that would, among other things, serve the near-term climate change information needs of the Regional Integrated Sciences and Assessments (RISAs; see www.climate.noaa.gov/cpo_pa/risa), the Regional Climate Centers (RCCs; see www.ncdc.noaa.gov/oa/climate/regionalclimatecenters.html), and the newly established National Integrated Drought Information System (NIDIS; see www.drought.gov). In Germany, the Climate Service Centre (CSC), funded by the German ministry for education and research for an initial period of about 5 yr, will start (likely early in 2009) a program for climate prediction over the next few decades (information online at www.clisap.de). In the United Kingdom, the U.K. Climate Impacts Programme (UKCP09; see http://ukcp09.defra.gov.uk/), established in 1997, provides climate model projections of twenty-first-century climate for use in national assessments of climate impacts and adaptation strategies. UKCP has published new probabilistic scenarios based on ensembles of climate model projections for a series of 30-yr periods covering from 2010–39 to 2070–99. In Italy, the Euromediterranean Center for Climate Change (www.cmcc.it) has been established with the mission to develop Earth system models for climate scenarios. It is focusing on the near-term period (2010–40) with high-resolution global models, using an approach that includes realistic initial conditions and emission scenarios. In September of 2009, the Third World Climate Conference established a Global Framework for Climate Services to initiate international cooperation in the provision of climate change information to stakeholders.


For many climate variables, decision makers are interested in the 10–30-yr time horizon (e.g., Pulwarty 2003), a time period that is characterized by a forced climate change signal that is often weaker than or comparable to the magnitude of internally generated climate variations. If skillful decadal climate predictions are to be realized, the time scale for which initial conditions are shown to impact the predictions will need to be extended by roughly an order of magnitude beyond today’s El Niño forecasts. That is, decadal prediction involves having some predictable signal in the initial state that has been ignored in traditional dec–cen climate change simulations.

In the decadal time range, at the confluence between dec–cen and SI, there may be a “sweet spot” for an enhanced signal-to-noise ratio of climate change information. The relative uncertainty in global-mean, decadal-mean surface air temperature predictions initially decreases with lead time as the predictions transition from initial state dependence to the forced response out to about 40 yr (Fig. 3). At longer lead times the emissions scenario uncertainty generally becomes dominant (Hawkins and Sutton 2009a).

Even if uncertainty is low in the decadal range relative to other periods, there remains the question of the signal-to-noise ratio, namely, the extent to which predictable regional variations could rise above noise from uncertainties in the forced response, and also from unpredictable aspects of internal variability, on those time and space scales (Barnett et al. 2008). On continental scales, the observed response to external forcing has clearly emerged from decadal climate variability (Hegerl et al. 2007). However, on spatial scales smaller than the subcontinental scale, it takes several decades for the forced signal to emerge (Karoly and Wu 2005; Knutson et al. 1999). The situation becomes more difficult for other climate variables, such as precipitation, where presently even large-scale forced changes are only marginally separable from internal climate variability (e.g., Zhang et al. 2007; Min et al. 2008).


No model will be perfect. The question is, how perfect a model do you need? There are multiple models which give a wide range of predictions, based on different parameters. The question is not will increasing GHG’s lead to warmer temperatures over time. The only question is “how much warmer and how fast?” the Canadian predictions are far from the most dire.


Why do you think you’re so much better able to judge the accuracy of these models than essentially all of the chief governmental research councils of the world? Have they all been duped?

Do you trust anything they tell you? (Why? Since you clearly do not trust them on one of the most important issues facing the planet.)
Printer Friendly | Permalink |  | Top
 
Nederland Donating Member (1000+ posts) Send PM | Profile | Ignore Fri Apr-15-11 11:06 AM
Response to Reply #43
45. Really?
The rate of warming from 1990-2000 is twice what was actually observed. As I mentioned before, if you include 2000-2010 the results are probably even worse. Do you honestly believe that being off by that much doesn't matter?

FYI, I don't even look at hindcasts. A model's ability to replicate the past is not a demonstration of skill, it is simple curve fitting. You know what the temperature curve is supposed to look like, so you keep tweaking the model until its right. The only true validation of a model comes from comparing forecasts to observations.
Printer Friendly | Permalink |  | Top
 
OKIsItJustMe Donating Member (1000+ posts) Send PM | Profile | Ignore Fri Apr-15-11 11:22 AM
Response to Reply #45
47. Yeah, really.
As any climate change “skeptic” will quickly point out, the climate is frightfully complex, and difficult to model. There’s an awful lot of “http://en.wikipedia.org/wiki/Chaos_theory">chaotic” activity in the system.

So, as I keep saying, prediction for the short term is quite difficult (like predicting a single throw of the dice.)

On the other hand, the physics of “Greenhouse Gasses” are quite well understood. So, as we’ve been told for some time now, if we continue to increase the levels of GHG’s in the atmosphere, the planet will continue to warm. (Although predicting the outcome of a single roll of the dice is difficult, in the long run, the casino always wins.)


That doesn't mean if we burn X amount of coal today the temperature will be Y°C warmer tomorrow, or if we burn X amount of coal this year that next year will be Y°C warmer. There are simply too many other factors involved.

Sadly, it also doesn't mean that if we stop burning fossil fuels tomorrow that the temperature will stop increasing. There’s a significant lag involved (like on the order of a century) between when we stop burning fossil fuels and when the temperatures will level off.
Printer Friendly | Permalink |  | Top
 
Nederland Donating Member (1000+ posts) Send PM | Profile | Ignore Fri Apr-15-11 10:06 PM
Response to Reply #47
59. Make up your mind
I being by saying that not enough time has passed to validate the models, and you disagree with me. So I posted a graph that shows that the model didn't do a very good job predicting what 1990-2000 would look like, and you say that is too short a period and we need to look at the longer trend. So which is it? Has enough time passed for us to validate the models or not?
Printer Friendly | Permalink |  | Top
 
OKIsItJustMe Donating Member (1000+ posts) Send PM | Profile | Ignore Sat Apr-16-11 02:38 PM
Response to Reply #59
73. The models are not validated simply by looking forward
They are also validated by "predicting" the past. If they appear to predict the past relatively well, then that indicates that they will also do a good job of predicting the future.

The models in question are not (as you suggest) 1 year old. That would be like saying Microsoft Word 2010 is untested, because it’s only one year old. Microsoft Word 2010 is simply the latest version of a 25 year old program. It’s got some new features, but at its heart it’s still the same old program.

The same goes for these computer programs. They’re based on AlGoreRhythms that have been under development for decades. 30 years ago, they gave us an idea of how much warming to expect in the future, and to date, those 30 year old predictions have proven pretty good. Since then, the models have been fleshed out more, taking more variables into account, but they’re not really giving us radically different results from what they were 30 years ago.
Printer Friendly | Permalink |  | Top
 
Nederland Donating Member (1000+ posts) Send PM | Profile | Ignore Sat Apr-16-11 04:25 PM
Response to Reply #73
76. Yes they are
Hindcasting proves absolutely nothing. Claiming that hindcasting proves anything is one of the very few things that I would say is an out and out lie in the IPCC AR4 report. Hindcasting is curve fitting, pure and simple. You run your model, compare your results to the historical record, make some alterations to better fit the data, and then repeat until something looks close. It proves absolutely nothing about whether or not your model is correct. The simple truth of the climate models is that you have 15-25 different non-linear inputs coming together to produce one output: temperature. It is a mathematical fact that in this situation there are literally trillions of possible ways to have those 15-25 inputs interact to get the right answer. Simply because you managed to come up with one set that produces a match to the historical record does NOT mean it is the correct one.

What makes this situation even worse is that for more than half of those 15-25 inputs that climate models use we do not have all the data for the entire historical record. Cloud cover data for example only exists since 1979, and it is a far more potent factor than CO2. So what data do the models use for all of these inputs that they don't have a full record for? They guess at the values. Doesn't that give you a nice warm and fuzzy feeling?
Printer Friendly | Permalink |  | Top
 
Nederland Donating Member (1000+ posts) Send PM | Profile | Ignore Sat Apr-16-11 04:14 AM
Response to Reply #47
64. Question
Do you believe that climate is a chaotic system? Do you know what a chaotic system is, and what its defining property is?
Printer Friendly | Permalink |  | Top
 
OKIsItJustMe Donating Member (1000+ posts) Send PM | Profile | Ignore Sat Apr-16-11 03:08 PM
Response to Reply #64
74. Yes, I understand what a chaotic system is
What I said, to be clear, was, “There’s an awful lot of ‘chaotic’ activity in the system.“

http://www.giss.nasa.gov/research/briefs/hansen_03/
Science Briefs

Forcings and Chaos in Global Climate Change

November 1997

A drought! A big snowstorm! What's causing it? People want something to "blame" for any climate fluctuation that occurs — surely it must be due to "El Nino" or the "greenhouse effect" or "something". A predilection for a deterministic explanation of climate variations is shared by scientists and laypersons.

But climate can fluctuate without help from any such "forcing" mechanism, simply because the atmosphere and ocean are fluids that are always sloshing about. There is no way to predict the timing and location of individual sloshes far ahead of time. This chaotic aspect of climate is a natural consequence of the fundamental "nonlinear" equations that describe the climate system.


A second conclusion is that year-to-year climate change at middle latitudes, such as the United States and Europe, are primarily chaotic fluctuations. Forcings such as greenhouse gases, on the average, alter temperature over two decades by only a few tenths of a degree, while chaotic fluctuations are several times larger. Thus the forcings, even from a strong El Nino, can modify the probability of unusual temperature or precipitation by a modest amount, but they do not allow for a reliable definitive forecast of seasonal climate. Therefore any claims that El Nino will do this or that to next winter's climate at middle or high latitudes should be taken with a large grain of salt.

Still a third conclusion of this study is an inference that Earth is not in radiative balance with space. Specifically, the observed temperature changes imply that Earth is absorbing about 0.5 Watt per square meter of sunlight more than it is emitting back to space. This imbalance is presumably due to greenhouse gases added to Earth's atmosphere over the past century, to which climate has only partially responded because of the large thermal inertia of the ocean. A consequence of this imbalance is that future warming of about 0.5°C can be expected even if atmospheric composition should remain fixed at today's amounts; i.e., future warming of 0.5°C is already "in the pipeline". It is this slow response of the climate system that complicates the issue of whether and how much greenhouse gas emissions should be restrained.


http://pubs.giss.nasa.gov/cgi-bin/abstract.cgi?id=ha09000a
Printer Friendly | Permalink |  | Top
 
OKIsItJustMe Donating Member (1000+ posts) Send PM | Profile | Ignore Wed Apr-13-11 10:19 AM
Response to Reply #11
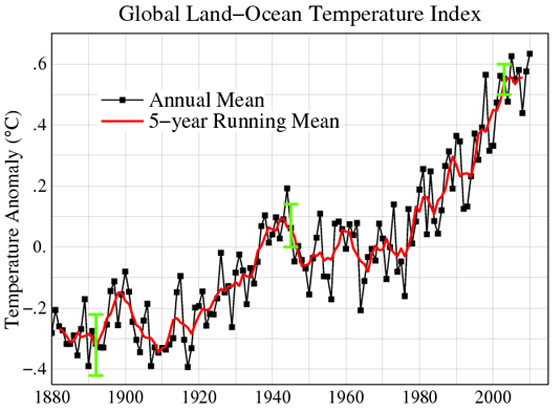
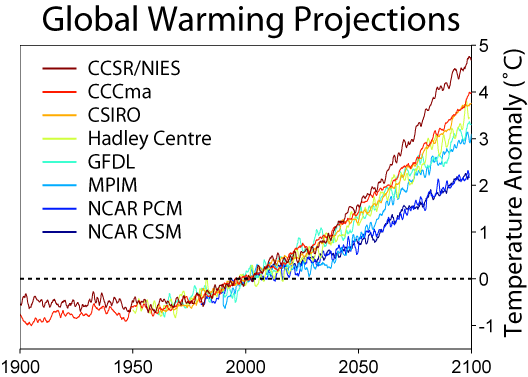
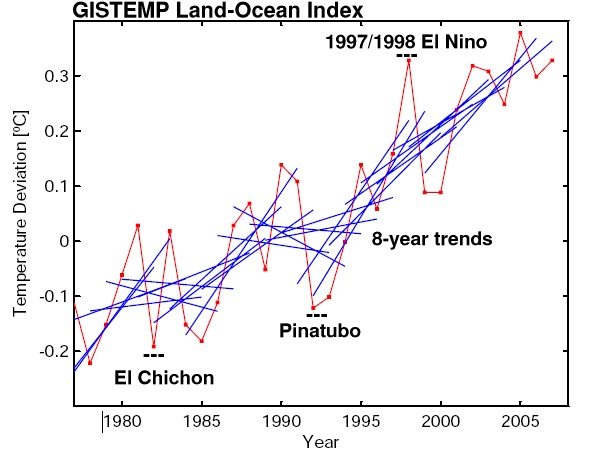
29. Current Temperature Graphs
You may have heard, 2010 was a warm year.

http://data.giss.nasa.gov/gistemp/graphs/


Printer Friendly | Permalink |  | Top
 
Nederland Donating Member (1000+ posts) Send PM | Profile | Ignore Fri Apr-15-11 01:31 AM
Response to Reply #29
38. Was it?
The fact is according to 4 out of the 5 temperature graphs, 2010 was cooler than 1998. In other years, 12 years went by without setting a new temperature record, even though the models say we should be seeing a new record high every eight years.
Printer Friendly | Permalink |  | Top
 
OKIsItJustMe Donating Member (1000+ posts) Send PM | Profile | Ignore Fri Apr-15-11 03:38 PM
Response to Reply #38
52. Um… really? I mean… seriously!?
How about this? 1998 was unusually warm, just as 1973 was or 1962 or 1944…
Printer Friendly | Permalink |  | Top
 
Nederland Donating Member (1000+ posts) Send PM | Profile | Ignore Sat Apr-16-11 03:45 AM
Response to Reply #52
62. Seriously
It is a FACT that 1998 was a statistical tie with 2010, and that means 12 years have gone by without much warming. Don't try to dodge the issue by bringing up other peaks the record. Its not about temporary peaks in the 20th century. Its about the FACT that we has seen little to no warming over the last 12 years, and the models did not see that coming.
Printer Friendly | Permalink |  | Top
 
Barrett808 Donating Member (1000+ posts) Send PM | Profile | Ignore Sat Apr-16-11 11:02 AM
Response to Reply #62
67. 12 years is not long enough to compute a reliable trend
You're being misled by noise.
Printer Friendly | Permalink |  | Top
 
Nederland Donating Member (1000+ posts) Send PM | Profile | Ignore Mon Apr-18-11 07:02 PM
Response to Reply #67
80. Ok, how many years do you need? (nt)
Printer Friendly | Permalink |  | Top
 
Barrett808 Donating Member (1000+ posts) Send PM | Profile | Ignore Mon Apr-18-11 07:22 PM
Response to Reply #80
81. Well, 18 years, as I've mentioned elsewhere in this thread. n/t
Printer Friendly | Permalink |  | Top
 
Barrett808 Donating Member (1000+ posts) Send PM | Profile | Ignore Mon Apr-18-11 09:00 PM
Response to Reply #81
82. 18 *more* years, I meant to say. n/t
Printer Friendly | Permalink |  | Top
 
Nederland Donating Member (1000+ posts) Send PM | Profile | Ignore Mon Apr-18-11 10:03 PM
Response to Reply #81
83. How ironic
I would actually say we only need 8 to 10 more years before we have a trend that can reliably validate the models.
Printer Friendly | Permalink |  | Top
 
Barrett808 Donating Member (1000+ posts) Send PM | Profile | Ignore Tue Apr-19-11 10:38 AM
Response to Reply #83
86. Obviously, I meant "years of data" not "more years of observation"
Edited on Tue Apr-19-11 10:42 AM by Barrett808
We already have plenty of data to validate the physics.
Printer Friendly | Permalink |  | Top
 
OKIsItJustMe Donating Member (1000+ posts) Send PM | Profile | Ignore Sat Apr-16-11 02:24 PM
Response to Reply #62
71. And 1999 was much cooler than 2010
So, 13 years have gone by, and the warming is happening at a tremendous rate!

You don’t get to choose your favorite 2 points to draw a line through.
Printer Friendly | Permalink |  | Top
 
Barrett808 Donating Member (1000+ posts) Send PM | Profile | Ignore Tue Apr-12-11 09:10 AM
Response to Reply #9
13. "All models are wrong, but some are useful." -- George E. P. Box
Printer Friendly | Permalink |  | Top
 
Odin2005 Donating Member (1000+ posts) Send PM | Profile | Ignore Tue Apr-12-11 10:10 PM
Response to Reply #9
24. Solipsistic pseudo-skeptical babble.
Little different than asking people to prove that the world was not created last Tuesday complete with all your memories.
Printer Friendly | Permalink |  | Top
 
Viking12 Donating Member (1000+ posts) Send PM | Profile | Ignore Wed Apr-13-11 06:28 AM
Response to Reply #24
25. +3 (+/-1.5)
Printer Friendly | Permalink |  | Top
 
hatrack Donating Member (1000+ posts) Send PM | Profile | Ignore Fri Apr-15-11 07:31 PM
Response to Reply #24
53. Yes, let's wait until models are accurate to 0.001C over multiple lifetimes of the universe . . .
And then we'll maybe talk about, oh, I dunno, allowing ourselves to be informed by the general trends they can finally accurately predict - though not in a way that might *shudder* cost money!!!

:silly:

Printer Friendly | Permalink |  | Top
 
XemaSab Donating Member (1000+ posts) Send PM | Profile | Ignore Fri Apr-15-11 10:35 PM
Response to Reply #53
61. Can I borrow a dollar?
:shrug:
Printer Friendly | Permalink |  | Top
 
Nederland Donating Member (1000+ posts) Send PM | Profile | Ignore Sat Apr-16-11 03:51 AM
Response to Reply #53
63. Nice strawman
I never said we needed to wait till models are accurate to 0.001C over multiple lifetimes of the universe. I'll be satisfied when the models don't predict three times as much warming as actually observed over a ten year period, as they did for 1998-2008. I'll be generous and say that the models need to get within 50% before I take them seriously. Or is that too hard for your "settled science" to pull off?
Printer Friendly | Permalink |  | Top
 
Barrett808 Donating Member (1000+ posts) Send PM | Profile | Ignore Sat Apr-16-11 11:03 AM
Response to Reply #63
68. A "ten-year period" is not long enough to infer a trend
You're chasing noise.
Printer Friendly | Permalink |  | Top
 
Nederland Donating Member (1000+ posts) Send PM | Profile | Ignore Sat Apr-16-11 01:40 PM
Response to Reply #68
69. Nice try
Edited on Sat Apr-16-11 01:41 PM by Nederland
Being off by 300% can't be blamed on "noise", even if the time period is admittedly short. If it makes you feel better though, you tell me what time period you'd like to us and we'll calculate the error for that time period instead. Just let me know, although I suspect you won't.
Printer Friendly | Permalink |  | Top
 
Barrett808 Donating Member (1000+ posts) Send PM | Profile | Ignore Sat Apr-16-11 07:16 PM
Response to Reply #69
77. This graph illustrates why you can't infer anything from short time periods:


The red line is the annual global-mean GISTEMP temperature record (though any other data set would do just as well), while the blue lines are 8-year trend lines – one for each 8-year period of data in the graph. What it shows is exactly what anyone should expect: the trends over such short periods are variable; sometimes small, sometimes large, sometimes negative – depending on which year you start with. The mean of all the 8 year trends is close to the long term trend (0.19ºC/decade), but the standard deviation is almost as large (0.17ºC/decade), implying that a trend would have to be either >0.5ºC/decade or much more negative (< -0.2ºC/decade) for it to obviously fall outside the distribution. Thus comparing short trends has very little power to distinguish between alternate expectations.

Uncertainty, noise and the art of model-data comparison

Printer Friendly | Permalink |  | Top
 
Viking12 Donating Member (1000+ posts) Send PM | Profile | Ignore Tue Apr-19-11 10:36 AM
Response to Reply #63
85. Are you a liar or simply willfully ignorant of what the near term projections actually are?
Printer Friendly | Permalink |  | Top
 
txlibdem Donating Member (1000+ posts) Send PM | Profile | Ignore Sun Apr-17-11 08:40 AM
Response to Original message
79. Video shows that it doesn't matter if climate data is exact or not
It shows the danger of choosing to wait too long or do nothing about global climate change.
http://www.youtube.com/watch?v=zORv8wwiadQ
Printer Friendly | Permalink |  | Top
 
DU AdBot (1000+ posts) Click to send private message to this author Click to view 
this author's profile Click to add 
this author to your buddy list Click to add 
this author to your Ignore list Tue Apr 16th 2024, 06:26 AM
Response to Original message
Advertisements [?]
 Top

Home » Discuss » Topic Forums » Environment/Energy Donate to DU

Powered by DCForum+ Version 1.1 Copyright 1997-2002 DCScripts.com
Software has been extensively modified by the DU administrators


Important Notices: By participating on this discussion board, visitors agree to abide by the rules outlined on our Rules page. Messages posted on the Democratic Underground Discussion Forums are the opinions of the individuals who post them, and do not necessarily represent the opinions of Democratic Underground, LLC.

Home  |  Discussion Forums  |  Journals |  Store  |  Donate

About DU  |  Contact Us  |  Privacy Policy

Got a message for Democratic Underground? Click here to send us a message.

© 2001 - 2011 Democratic Underground, LLC