DavidDvorkin
 (1000+ posts)
Send PM |
Profile |
Ignore
(1000+ posts)
Send PM |
Profile |
Ignore
|
Mon May-05-08 09:53 AM
Original message |
| Rasmussen daily graph for 5/5/08 - Obama up 1 (46), Clinton unchanged (45) |
|
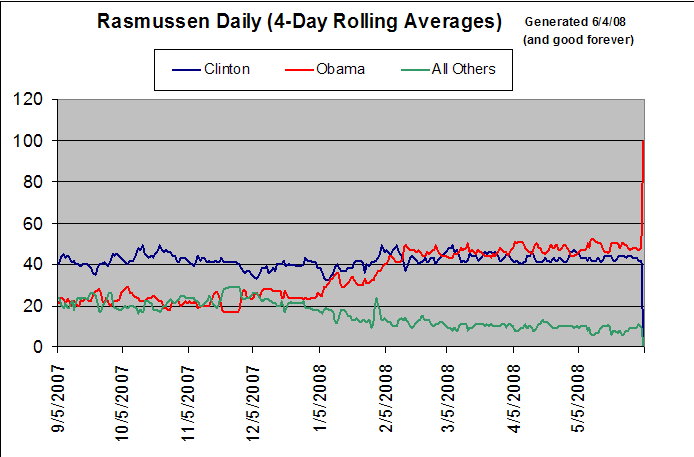   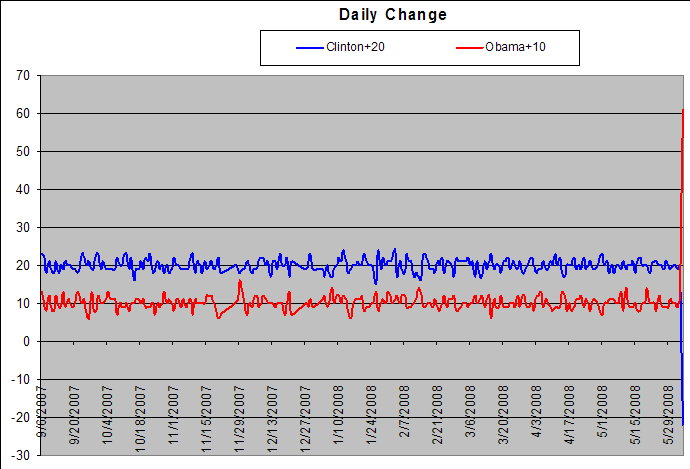 (Pretend that the 10 and 20 lines are actually 0. Does anyone know how to make Excel label different parts of the axis differently?) Thanks to DUer Austinitis, we also have these nifty favorability graphs: http://spreadsheets.google.com/pub?key=pLYPNryKcVU1Vud9WwRj7KQ&oid=7&output=imagehttp://spreadsheets.google.com/pub?key=pLYPNryKcVU1Vud9WwRj7KQ&oid=8&output=imageGallup: http://www.gallup.comThese Rasmussen graphs are all contained on one Web page at http://www.dvorkin.com/rastrack.htmlRasmussen links: Data in tabular form Discussion |
| DavidDvorkin
(1000+ posts)
Send PM |
Profile |
Ignore
|
Mon May-05-08 10:40 AM
Response to Original message |
| DavidDvorkin
(1000+ posts)
Send PM |
Profile |
Ignore
|
Mon May-05-08 01:04 PM
Response to Original message |
| 2. Gallup: Obama 50, Clinton 45 |
DU
AdBot (1000+ posts)     |
Fri May 03rd 2024, 05:14 AM
Response to Original message |