Democratic Underground Latest Greatest Lobby Journals Search Options Help Login
Google

KERRY VOTE DEVIATIONS ACROSS TIME ZONES

Printer-friendly format Printer-friendly format
Printer-friendly format Email this thread to a friend
Printer-friendly format Bookmark this thread
This topic is archived.
Home » Discuss » Topic Forums » Election Reform Donate to DU
 
TruthIsAll Donating Member (1000+ posts) Send PM | Profile | Ignore Sat Dec-11-04 11:43 AM
Original message
KERRY VOTE DEVIATIONS ACROSS TIME ZONES
Edited on Sat Dec-11-04 12:32 PM by TruthIsAll
 
Kerry Exit Poll Deviations across Time Zones

Is there a relationship between the percentage deviations and
the time zones? Perhaps. 

Look at the Eastern time zone, where Kerry had his highest
exit poll margins. The average vote tally deviation was -2.7%.
This is much higher than corresponding percentages as we go
West.

The Pacific time zone which includes OR (all paper ballot) had
the smallest decline: -0.4%

ZONE Num Over3%Exit Vote Diff
East 21 11 53.1 50.5 -2.7
Cent 16 4 43.4 42.4 -1.0
Mount 8 0 41.4 39.7 -1.7
Pacif 5 1 50.8 50.3 -0.4

Total 50 16 47.2 45.7 -1.5


Note: The averages are unweighted, meaning they do not take
into account the voting population. When they are weighted,
Kerry got about 50.5% based on exit polls vs. Bush.

***************************************************************
The breakdown summary:

Eastern: 20 of 21 states deviated to Bush (11 exceeded 3%)
Kerry's Average 53.1% Exit Poll declined to 50.5% in the vote
tally.

Central: 11 of 16 states deviated to Bush (4 exceeded 3%)
Kerry's Average 43.4% Exit Poll declined to 42.4% in the vote
tally.

Mountain: 7 of 8 states deviated to Bush (NONE exceeded 3%)
Kerry's Average 41.4% Exit Poll declined to 39.7% in the vote
tally.

Pacific: 2 of 5 states deviated to Bush (1 exceeded 3%)
Kerry's Average 50.8% Exit Poll declined to 50.3% in the vote
tally.

A total of 40 out of 50 states deviated to Bush (16 exceeded
3%)

*************************************************************
	Zone	State	Exit	Vote	Diff
1	e	DE	58.5	53.5	-5.0
2	e	NH	55.4	50.5	-4.9
3	e	VT	65.0	60.2	-4.8
4	e	SC	46.0	41.4	-4.6
5	e	NC	48.0	44.0	-4.0
6	e	NY	63.0	59.2	-3.8
7	e	CT	58.5	55.1	-3.4
8	e	RI	64.0	60.6	-3.4
9	e	MA	66.0	62.6	-3.4
10	e	PA	54.4	51.0	-3.4
11	e	OH	52.1	49.0	-3.1
12	e	FL	50.5	47.5	-3.0
13	e	WV	45.3	43.4	-1.8
14	e	IN	41.0	39.4	-1.6
15	e	GA	43.0	41.4	-1.6
16	e	NJ	55.0	53.5	-1.5
17	e	KY	41.0	40.0	-1.0
18	e	MI	52.5	51.5	-1.0
19	e	ME	54.8	54.1	-0.7
20	e	MD	57.0	56.6	-0.4
21	e	VA	45.2	45.5	0.3
					
1	c	NE	36.8	32.3	-4.4
2	c	AL	41.0	37.0	-4.0
3	c	MS	43.3	40.0	-3.3
4	c	MN	54.5	51.5	-3.0
5	c	LA	44.5	42.4	-2.1
6	c	IL	57.0	55.0	-2.0
7	c	WI	52.5	50.5	-2.0
8	c	MO	47.5	46.0	-1.5
9	c	IA	50.7	49.5	-1.2
10	c	AR	46.6	45.5	-1.1
11	c	OK	35.0	34.0	-1.0
12	c	TX	37.0	38.4	1.4
13	c	TN	41.5	43.0	1.5
14	c	SD	37.8	39.4	1.6
15	c	ND	34.0	36.4	2.4
16	c	KS	35.0	37.4	2.4
					
1	m	UT	30.5	27.6	-2.9
2	m	ID	33.5	30.6	-2.9
3	m	AZ	47.0	44.4	-2.6
4	m	NM	51.3	49.5	-1.8
5	m	CO	49.1	47.5	-1.6
6	m	WY	30.9	29.6	-1.3
7	m	NV	49.4	48.5	-0.9
8	m	MT	39.8	39.8	0.0
					
1	p	AK	40.5	36.1	-4.4
2	p	WA	55.0	53.5	-1.4
3	p	OR	51.2	52.0	0.8
4	p	HI	53.3	54.5	1.2
5	p	CA	54.0	55.6	1.6


Printer Friendly | Permalink |  | Top
KoKo Donating Member (1000+ posts) Send PM | Profile | Ignore Sat Dec-11-04 11:51 AM
Response to Original message
1. TIA for us "statistically challenged" could you explain a little what this
means? Thanks..
Printer Friendly | Permalink |  | Top
 
IAMREALITY Donating Member (1000+ posts) Send PM | Profile | Ignore Sat Dec-11-04 11:55 AM
Response to Reply #1
2. Layman Explanation
For those statistically challenged, always be aware that when TIA posts his strong statistical analysis's they always boil down to the same thing....

....We were Fucked, and Fucked Hard, by fraud.

:)
Printer Friendly | Permalink |  | Top
 
Griffy Donating Member (1000+ posts) Send PM | Profile | Ignore Sat Dec-11-04 05:20 PM
Response to Reply #2
28. dont work so hard to prove what you know... WE NEED..
to take to the STREETS ... NOW.. the revolution has begun.. PROTEST AND WE CAN WIN THIS... I beg you all to focus on planning rallies, telling friends and family... there are plenty of facts already, dont tell them Kerry won as much as you feel the right to vote is being stripped from us ALL!
Printer Friendly | Permalink |  | Top
 
buzzard Donating Member (1000+ posts) Send PM | Profile | Ignore Sun Dec-12-04 12:20 AM
Response to Reply #2
39. You are right on, I don't need any more convincing.
I just got back from a Christmas party and we were all discussing the election results. I would say about 80% believe there was fraud and the rest think the DNC didn't want to win this time round. I don't think so because after 4 more years of Bushco the mess will be so much worse especially if he gets his choice of supreme court judges. Why would they want to lose this one. Canadians care too.
Printer Friendly | Permalink |  | Top
 
TruthIsAll Donating Member (1000+ posts) Send PM | Profile | Ignore Sat Dec-11-04 12:00 PM
Response to Reply #1
3. It is simply a breakdown by time zone of Kerry's exit poll vs. tallies
Edited on Sat Dec-11-04 12:04 PM by TruthIsAll
Is there a relationship between the percentage deviations and the time zones? Perhaps.

Look at the Eastern time zone, where Kerry had his highest exit poll margins. The average vote tally deviation was -2.7%. This is much higher than corresponding percentages as we go West.

The Pacific time zone which includes OR (all paper ballot) had the smallest decline: -0.4%

ZONE Num Over3%Exit Vote Diff
East 21 11 53.1 50.5 -2.7
Cent 16 4 43.4 42.4 -1.0
Mount 8 0 41.4 39.7 -1.7
Pacif 5 1 50.8 50.3 -0.4

Total 50 16 47.2 45.7 -1.5


Printer Friendly | Permalink |  | Top
 
L. Coyote Donating Member (1000+ posts) Send PM | Profile | Ignore Sat Dec-11-04 05:10 PM
Response to Reply #3
27. Time zones, electoral college votes, and swing states??
Which is determining the pattern? The big electoral swing states in the East are the ones skewing the pattern.

Assuming there were baseline shifts within margins of error, Blue shift in CA and Red shifts elsewhere, where does the shift exceed the margin of error?

After sorting to "difference exceeds absolute value 3.0" (a liberal and generous margin of error), then resorting by electoral college votes, these states remain suspect, esp. RE popular votes:

NY -3.8 31
FL -3.0 27
PA -3.4 21
OH -3.1 20
NC -4.0 15
VT -4.8 13
MA -3.4 12
MN -3.0 10
AK -4.4 9
SC -4.6 8
CT -3.4 7
MS -3.3 6
NE -4.4 5
RI -3.4 4
NH -4.9 4
DE -5.0 3
AL -4.0 3

Of these, the states where Kerry is within 3.0 % of winning/losing are:

MN -3.0 51.5
PA -3.4 51.0
NH -4.9 50.5
OH -3.1 49.0
FL -3.0 47.5

Next, sort out the states Kerry won and the focus for fraud ought to be:

OH -3.1 20
FL -3.0 27

If you had good polls before the vote, these are the states you would need to fix to change the outcome.


Duh! Huh?
Printer Friendly | Permalink |  | Top
 
newyawker99 Donating Member (1000+ posts) Send PM | Profile | Ignore Sat Dec-11-04 07:40 PM
Response to Reply #27
32. Hi L. Coyote!!
Welcome to DU!! :toast:
Printer Friendly | Permalink |  | Top
 
jagsd01 Donating Member (26 posts) Send PM | Profile | Ignore Sat Dec-11-04 08:06 PM
Response to Reply #1
34. Statistically challenged
No logical reason for the difference by time zone except either different procedures by time zone or GOP fraud. If the Dem vote was overstated in the exit polls, we would have seen the four blue West Coast states with negative values, but in reality, just the opposite !
Printer Friendly | Permalink |  | Top
 
Truman01 Donating Member (733 posts) Send PM | Profile | Ignore Sat Dec-11-04 12:12 PM
Response to Original message
4. I have a question for you................
Looking at your data, 12 of the 20 Bush shifted east coast results were handily won by John Kerry. These had and average shift toward Bush of 2.89% from the exit polling but Kerry still won them by an average of 55.7%.

My question is, why the shift in these states? Surely they didn't have these states rigged too. Why would you risk discovery in states that are heavily against you?

Yet, if they didn't rig these states, then what is the explanation for the shift in these states, and what does that say about our whole model?

BTW I am very impressed with your talent in this area. I could never do stats like this.

TC
Printer Friendly | Permalink |  | Top
 
rdmccur Donating Member (622 posts) Send PM | Profile | Ignore Sat Dec-11-04 12:16 PM
Response to Reply #4
5. The reason was
to pad Bush's popular vote, simply that.
Printer Friendly | Permalink |  | Top
 
Truman01 Donating Member (733 posts) Send PM | Profile | Ignore Sat Dec-11-04 12:27 PM
Response to Reply #5
6. That doesn't make any sense in blue states.....
The risk of trying to pad the votes in heavily democratic states doesn't make much sense. If they want to pad votes it would be much easier to pad Texas, or Georgia, not New York and Delaware.

TC
Printer Friendly | Permalink |  | Top
 
Karenca Donating Member (1000+ posts) Send PM | Profile | Ignore Sat Dec-11-04 12:33 PM
Response to Reply #6
8. It does make sense..
The votes were also padded in states with tremendous populations> The bastards figured noone would notice the excess votes in such large states, thus giving B*sh not only the electoral college, but the polpular vote as well.
They figures if they also had the popular vote, there would be no ?'s about rigging, unlike Gore/B*sh with only a 527 vote difference.
Printer Friendly | Permalink |  | Top
 
TruthIsAll Donating Member (1000+ posts) Send PM | Profile | Ignore Sat Dec-11-04 12:43 PM
Response to Reply #6
9. That is not a valid assumption. If they want to pad, what difference
Edited on Sat Dec-11-04 12:45 PM by TruthIsAll
does it make if they pad from solid Red states or solid Blue states?
The real issue is population size.

The idea is to pad the popular vote; the electoral vote is of no consequence. They need to pad in order to make it appear they really won big - and to switch the real Kerry 51-48 win to a 51-48 loss.

Take NY. Lots of votes. Heavy Dem state. If you can lower Kerry's percentage from 62% to 60%, that 2% shift makes a lot more difference in the popular vote than it would in MS, for example.

And no one would even notice it.

Except DU.
Printer Friendly | Permalink |  | Top
 
rdmccur Donating Member (622 posts) Send PM | Profile | Ignore Sat Dec-11-04 01:16 PM
Response to Reply #9
14. Exactly.
Printer Friendly | Permalink |  | Top
 
Truman01 Donating Member (733 posts) Send PM | Profile | Ignore Sat Dec-11-04 01:30 PM
Response to Reply #9
19. So now you are back to a nationwide conspiracy.
So the question is how do you pull such a monstrosity off? Thousands of precincts, many in unfriendly areas. Different voting machines, different programs. You have machines in Democratic counties, with democratic officials both state and local.

I can see a plan to take out Florida, or Ohio, and even that would be a HUGE job but a plan to rig every voting precinct in the nation? Or to rig votes in every state? That simply defies logic.

Don't you think?

TC
Printer Friendly | Permalink |  | Top
 
Peace Patriot Donating Member (1000+ posts) Send PM | Profile | Ignore Mon Dec-13-04 04:18 AM
Response to Reply #19
52. Have you read Black Box Voting, or the Johns Hopkins...
...report on electronic voting, or chuckherrin.com?

It's as easy as pie to hack these machines (one hacker, a couple of minutes). Further, the votes are all sent to centralized electronic vote tabulators run by SECRET proprietary source code, controlled by companies with CEO's committed to Bush Inc. Chuck Herrin debunks the myth that hacking an election, given these conditions, requires a vast conspiracy. It does not.

These companies insisted on secret source code and paperless voting. Why would they insist so (and get Tom DeLay to prevent a paper trail provision from getting out of committee)? Their ATMs have a paper receipt. Why not voting machines?

Also, have you read the studies, for instance, by ignatzmouse, on the NC election, absentee ballot (30% of the vote) vs. electronic voting? A 6% margin for Bush in absentee ballots. A 12% margin for Bush in the electronic voting. The UC Berkeley study also confirms that electronic voting greatly favors Bush, at near impossible odds.

The UC Berkeley study further establishes that they manufactured votes for Bush, or stole votes from Kerry, in FLA's three biggest Democratic counties. If Dem counties, why not Dem states? (--rather good places to hide the theft of a few %'s here and there--who would look closely at it, with all the difficulties of auditing electronic voting, if Kerry won by a comfortable margin?)

Also, how better to hide it than spreading it around--a bit here, a bit there--rather than big noticeable chunks? (--although they seem to have messed up in FLA; Berkeley estimated they took 130,000 to 260,000 votes in those 3 Dem counties).

The fraud didn't have to occur in all 51 states. I would think 10 to 20 states would be sufficient. With a "back door" pre-written into these highly insecure electronic machines--a line or two of code--someone could easily get in, even remotely. (Johns Hopkins mentions election workers, or the building's janitor, when discussing how quick and easy the fraud could be.)

If you think imaginatively, like a Fraudster designing the 2004 election to favor Bush, you realize that they needed at least two things: 1) the Electoral Vote (to win); and 2) the popular vote, to avoid the taint of '00.

These are two different calculations, needing different fraud strategies. Some of their stolen Electoral Votes would likely be found in "red" states that were threatening to turn "blue" at the time of the election (New Mexico, for instance)--just a small tweak needed. And the multiple kinds of election crime that occurred in OH and FLA served several purposes, one of them being Electoral Votes.

They also needed to make it look like it all came down to a relatively few provisional ballots in one state (OH or FLA). This was taken care of by the severe vote suppression activities of Ohio's Republican Sec'y of State, and Jeb & Co. in FLA.

A fourth requirement was public perception--taken care of by the TV networks, by feeding the official electronic tally results into the Exit Poll data, late in the day, hiding Kerry's big numbers in the Exit Polls, and making it appear that Bush had taken a late lead in the Exit Polls, when all that was really reflected was the Republican-controlled electronic vote tally.

I don't know who exactly is responsible for the latter (AP and the networks? --probably not the Exit Poll company). But it was one of the greater acts of malfeasance I've seen in US journalism. (In the Ukraine, people got to see both numbers--the Exit Polls and the official tally--separately, as they should be seen.) All this would have taken was a phone call from the White House.

It's a fairly simple plan, altogether--useful as a working hypothesis of what they had to do. TruthIsAll's current stats seem to indicate we should be looking mostly at the east coast. I've been helping a bit with the California project. I don't know if there is such a project in New York. There certainly should be!

Printer Friendly | Permalink |  | Top
 
dlaliberte Donating Member (168 posts) Send PM | Profile | Ignore Sat Dec-11-04 12:54 PM
Response to Reply #6
10. It makes more sense in non-contested states
I would not be surprised to learn that votes were moved from Kerry to Bush in many states, throughout the nation. It makes even more sense to do it in non-contested states, both blue and red, because there is very little chance for a recount in those states, and thus any fraud will be invisible, except for the statistical evidence we have. And it is easy to rationalize that if the popular vote in blue states is less than expected, so what, Kerry won in those states anyway.

It would be less suspicious to simply reduce Kerry votes in blue states (making the margin less) than to increase Bush votes in red states (making the margin even greater), and as long as they keep the tally far enough away from a 50-50 split, who is going to spend time recounting?

For the same reason, you have to look at counties within the states, and precincts within the counties, to find those that are less likely to be contested, and thus it would be easier to hide the fraud.
Any recount that occurs anywhere is a risk for discovering fraud.

Actually, recounts of paperless counties won't help discover fraud where the tally is made consistent with the reported votes. And even with paper trails, the papers can be shuffled, given enough time, but it is harder for them to do that.
Printer Friendly | Permalink |  | Top
 
dogindia Donating Member (1000+ posts) Send PM | Profile | Ignore Sat Dec-11-04 12:28 PM
Response to Original message
7. TIA you are awesome.
Edited on Sat Dec-11-04 12:48 PM by dogindia
i honor your diligence and commitment. I have watched with great pleasure all your posts and graphs. I thank you.
Printer Friendly | Permalink |  | Top
 
myschkin Donating Member (488 posts) Send PM | Profile | Ignore Sat Dec-11-04 01:03 PM
Response to Original message
11. The few exceptions of the Red-Shift
Edited on Sat Dec-11-04 01:39 PM by myschkin

were Montana, Oregon, Hawaii, California, Tennessee, Texas, South Dakota, Kansas, North Dakota - all (except of Tennesse) on the left half of the US territory. This suggest that Rove (or whoever) didn't need to manipulate the west coast vote anymore because the manipulations of the east coast already gave him the national vote. Also I think these states have paper trail (can somebody check this?).

I think this one-sided concentration of Kerry Shift-states on the west side of the US can't be an accident.

Probability, TIA? 1: 1 Billion? ;-)


Printer Friendly | Permalink |  | Top
 
TruthIsAll Donating Member (1000+ posts) Send PM | Profile | Ignore Sat Dec-11-04 01:11 PM
Response to Reply #11
12. That is an interesting observation.
Edited on Sat Dec-11-04 01:11 PM by TruthIsAll
It would make strategic sense: don't steal any more than is necessary.

But...they already stole more than enough votes to make it obvious.

*********51-48 Kerry to 50.5-48.5 Bush*********
Printer Friendly | Permalink |  | Top
 
rdmccur Donating Member (622 posts) Send PM | Profile | Ignore Sat Dec-11-04 01:24 PM
Response to Reply #11
16. Freeman didn't analyze that but
one could get a fair estimate of that probability from what he did do.
I still wonder about California though. At least in the early day vote there may have been some vote switching. I wonder if anyone has looked at the early vs late vote trends in states such as California (in the western US)? There is a DU thread on investigating the California election --Myschkin or TruthIsAll, were either of you involved in that?
Also Madsen mentions Texas as another state where significant padding took place (according to his sources).
Printer Friendly | Permalink |  | Top
 
TruthIsAll Donating Member (1000+ posts) Send PM | Profile | Ignore Sat Dec-11-04 01:28 PM
Response to Reply #16
18. Not me. I only looked at FL.
tia
Printer Friendly | Permalink |  | Top
 
myschkin Donating Member (488 posts) Send PM | Profile | Ignore Sat Dec-11-04 01:34 PM
Response to Reply #16
22. -

No, I was not involved in the California fraud...

Printer Friendly | Permalink |  | Top
 
rdmccur Donating Member (622 posts) Send PM | Profile | Ignore Sat Dec-11-04 11:15 PM
Response to Reply #16
37. I asked this question to the lead
of the California project to search for evidence of anomalies in California (George). I'll post the answer here if and when I get one.
Printer Friendly | Permalink |  | Top
 
seaclyr Donating Member (182 posts) Send PM | Profile | Ignore Sat Dec-11-04 01:14 PM
Response to Original message
13. Makes a lot of sense
Also - I think consistent with what you're finding - early popular vote tallies were way in Bush's favor - he was up 12% or more according to cnn through 8:46pm EST (jbond56 and I tracked the numbers). Other thing being equal, you'd expect east coast states to be reporting at that time.
Printer Friendly | Permalink |  | Top
 
TruthIsAll Donating Member (1000+ posts) Send PM | Profile | Ignore Sat Dec-11-04 01:27 PM
Response to Reply #13
17. WTF? The early votes were heavy Bush and the exit polls were heavy Kerry.
n/t

Pursue this.
Printer Friendly | Permalink |  | Top
 
BlueDog2u Donating Member (692 posts) Send PM | Profile | Ignore Sat Dec-11-04 01:31 PM
Response to Reply #17
20. Yes, that is indeed an interesting and provocative observation
Printer Friendly | Permalink |  | Top
 
tex-wyo-dem Donating Member (1000+ posts) Send PM | Profile | Ignore Sat Dec-11-04 01:51 PM
Response to Reply #13
24. Excellent analysis, TIA!
And tieing it together with seaclyr's graph above makes even more sense. Pad the vote in the heavily populated east coast early in the night (people will be less suspicious if B*sh shows an early lead in the popular vote - his winning later in the night will look legit). Once the fix is in, sit back and don't worry about smaller western/west coast states, unless, of course, a state needs to be won for sybolic purposes (i.e. NM, CO, NV).

The wide varience between the exit polls on the east coast and B*sh's early lead, which eroded as the vote moved westward where the exit polls more closely matched actual vote tallys speaks volumes.

Printer Friendly | Permalink |  | Top
 
seaclyr Donating Member (182 posts) Send PM | Profile | Ignore Sat Dec-11-04 05:25 PM
Response to Reply #24
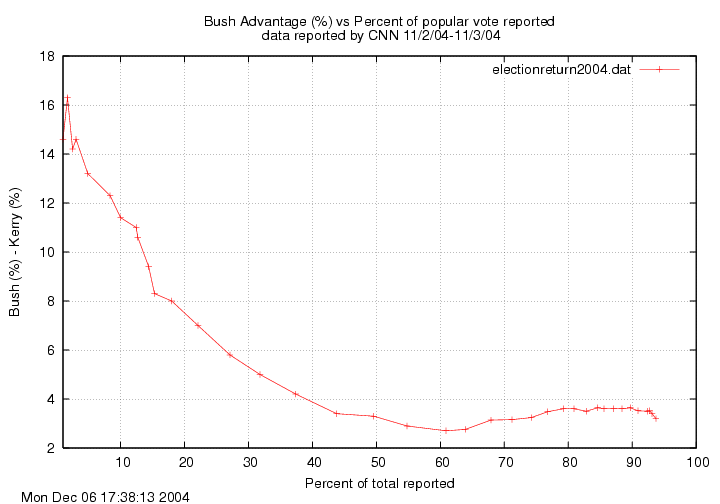
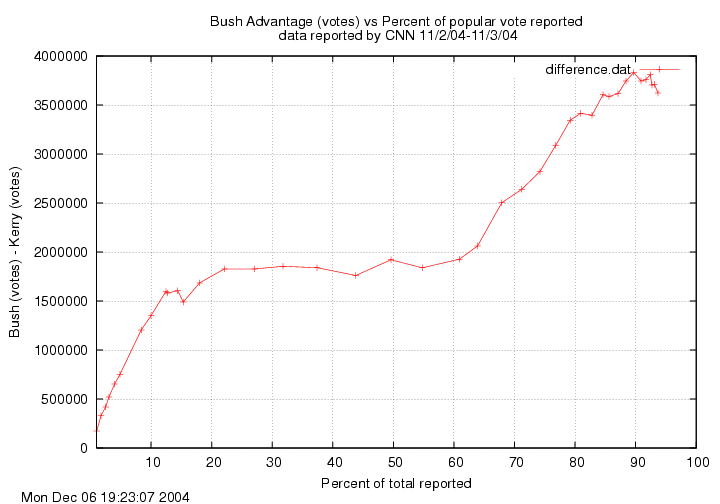
29. Also, look at the vote difference over time
Early popular vote Bush lead (1.8 million votes early) then more votes (would you believe another 1.8 million votes) later. The x-axis is percent popular vote reported, doesn't have times on yet, but 10% was in by 8:50pm est, 20% by 9:30pm est, 60% by 11:25pm est, 80% by 1:19am est. We have all the info on a spreadsheet we can share.
Printer Friendly | Permalink |  | Top
 
myschkin Donating Member (488 posts) Send PM | Profile | Ignore Sat Dec-11-04 06:34 PM
Response to Reply #24
31. more proof, yes!
Edited on Sat Dec-11-04 06:38 PM by myschkin

Yes, that's what I forgot to say! There are some battleground states on the left half of US - Nevada, New Mexico, Colorado, also a bit Arizona - and they had of course NO blue Kerry-shift!!!!!

:-)

God!

Printer Friendly | Permalink |  | Top
 
trudyco Donating Member (975 posts) Send PM | Profile | Ignore Sat Dec-11-04 01:19 PM
Response to Original message
15. Of course pad in non-swing states
They could pad in any non-swing state with evoting/no paper trail. If they had to shift votes in swing states they probably figured it was no more dangerous to lightly pad in non-swing states. If they were going to get caught it would be in the closely watched swing states where they had to pad more anyway to make sure they swung to Bush. Once you're committed you might as well go all the way.

In the non-swing they could have padded by the evoting/no paper trail but also I think maybe the tabulators slightly padded. It was interesting that in the 2.6 Dixiecrat counties in Florida Shrub got extra phantom votes. I bet that little blip is programmed into the tabulator. SOmething, that if looked at, could plausibly be called a minor software bug. Not many votes padded, but 10 votes in every precinct plus higher spoilage rates/voter suppresion in Dem counties would add up significantly.

I think they really wanted to tell the lie that the country was swinging Red. Everywhere. Remember how upset people were that Gore won the popular vote but lost the electoral? They were hoping that B*sh Man date would squash protests from the opposition. It would also add credence to the vote flipping they did in the Senate and Congressional seats.

I'm still wondering how complicit the media/AP and Mitkofsky were in this. Who was Rove wired up to on election night?

trudyco
Printer Friendly | Permalink |  | Top
 
myschkin Donating Member (488 posts) Send PM | Profile | Ignore Sat Dec-11-04 01:46 PM
Response to Reply #15
23. Please

read this article: http://www.washingtonpost.com/wp-dyn/articles/A23580-2004Nov3.html

This was the time frame in which Rove rigged the election.

Has he an alibi?


"On Tuesday, new problems surfaced: A 2 1/2-HOUR DATA BLACKOUT and samples that at one point or another included too many women, too few Westerners, not enough Republicans and a lead for Democratic presidential nominee John F. Kerry in the national survey that persisted until late in the evening."

Printer Friendly | Permalink |  | Top
 
RaulVB Donating Member (1000+ posts) Send PM | Profile | Ignore Sat Dec-11-04 01:33 PM
Response to Original message
21. Good you pointed that out
Because the West Coast variation is minimal, indeed.

You needed to steal it elsewhere in order to "succeed."
Printer Friendly | Permalink |  | Top
 
L. Coyote Donating Member (1000+ posts) Send PM | Profile | Ignore Sat Dec-11-04 04:10 PM
Response to Original message
25. Another graphic. This correlates with electoral college votes
Your data is now part of the "Exit Poll and Actual Voting Discrepancy" Excel file, including a graphic by states showing the correlation with electoral college votes instead of time zones. Other statistics are included in the spreadsheet. If you have different exit poll stats, just plug them in.

The graphic clearly illustrates how states with higher electoral votes have greater differences, and the graphic includes a data table with four variables, exit polls, Kerry vote, electoral college votes, and difference.

You can download the large image file (360 Kb) or the Excel file.
Printer Friendly | Permalink |  | Top
 
bleever Donating Member (1000+ posts) Send PM | Profile | Ignore Sat Dec-11-04 04:37 PM
Response to Original message
26. This fits the MO of Rove to project the impression of inevitability.
In so many different arenas they practice the same kind of perception-management, trying to make their victory seem inevitable, already a done deal, resistance is futile, assimilate or be laughed into oblivion.

Hence, the early padding on the east coast, the need for a popular vote victory so no one could quibble about the little things, and the need to get * and the whole Hee-Haw gang on TV that evening, from the WH, to project an aura of victory (even though the fix was yet to be fully completed).

But, as TIA points out, they overstole. The family photo-op looked weird. And there was also DU.
Printer Friendly | Permalink |  | Top
 
msongs Donating Member (1000+ posts) Send PM | Profile | Ignore Sat Dec-11-04 07:52 PM
Response to Reply #26
33. no evidence John Kerry cares about any of this, is there?...
"I will fight..." pretty much turned into "I have abandoned ship..."

Msongs
Riverside Ca

political shirts at
www.msongs.com/political-shirts.htm
Printer Friendly | Permalink |  | Top
 
Peace Patriot Donating Member (1000+ posts) Send PM | Profile | Ignore Mon Dec-13-04 04:41 AM
Response to Reply #33
53. Wrong!
"...no evidence John Kerry cares about any of this..."

See DU (and over a thousand news media outlets) on 12/12/04, 12/13/04. Kerry has requested independent auditing of 88 Boards of Elections in Ohio, and says that abuses and anomalies listed could change the outcome. I'm beginning to believe the man is a rattlesnake (that's a compliment!). We'll see. But he is clearly involved in the recount and the lawsuits.
Printer Friendly | Permalink |  | Top
 
corbett Donating Member (1000+ posts) Send PM | Profile | Ignore Sat Dec-11-04 10:20 PM
Response to Reply #26
35. Family Photo Op Was A Joke
It was really easy to see the fear in Dubya's eyes. To my perception, it was a look of, "Do I have to win by cheating 'gain? Well, I suppose I can live wit' that."
Printer Friendly | Permalink |  | Top
 
bleever Donating Member (1000+ posts) Send PM | Profile | Ignore Sat Dec-11-04 10:26 PM
Response to Reply #35
36. Ding ding ding! n/t
Printer Friendly | Permalink |  | Top
 
seaclyr Donating Member (182 posts) Send PM | Profile | Ignore Sat Dec-11-04 05:31 PM
Response to Original message
30. Vote difference over time
Meant to post here - look at the vote difference over time shown in #29
Printer Friendly | Permalink |  | Top
 
samfish Donating Member (14 posts) Send PM | Profile | Ignore Sat Dec-11-04 11:36 PM
Response to Original message
38. Perhaps I'm just playing Devil's Advocate here, but...
I'm no statistician, I'm a designer by trade, so forgive me if I'm not even looking on the same page here,
But isn't there a case to be made that these findings might actually support the notion that there was something wrong with the way the exit polling was done earlier in the day (the men/women ratio thing)?
That it was then corrected later in the night and in the remaining time zones to adjust for the fact that they were weighted?
If I'm horribly wrong here, I appologize, but to me this sounds like a case of Ackham's razor...
Printer Friendly | Permalink |  | Top
 
myschkin Donating Member (488 posts) Send PM | Profile | Ignore Sun Dec-12-04 01:57 PM
Response to Reply #38
45. No
Edited on Sun Dec-12-04 02:00 PM by myschkin

They were weighted before... There is no big difference between the (weighted) 16:00 and the final polling. But the END-polling was fitted to the vote result -

a scandal in my eyes! (but i live in Europe)


Printer Friendly | Permalink |  | Top
 
L. Coyote Donating Member (1000+ posts) Send PM | Profile | Ignore Sun Dec-12-04 03:24 AM
Response to Original message
40. Exit Poll Difference -- Correlation to Votes, w/ Red vs. Blue compared.
Here is a graphic of the Pearson correlations.


Basically, the red shift happened in blue states.

Kerry's vote percentages are all positive numbers, the difference mean is negative. The correlation value is negative, indicating numbers in the positive dataset increase while their counterparts (FL :FL, OH :OH, etc.) increases negatively.

Conclusion: In blue states, the higher the Kerry percentage, the greater the negative value of the difference. However, the correlation is not perfect.

This is the opposite of the correlation in red states, where the correlation is practically insignificant.

Regarding the correlation of Electoral College votes and the difference, opposite correlations prevail. While several big prizes have significant differences, the national picture does not show greater red shift in states with more electoral votes.

For those not into stats, Pearson correlations determine the relationship of 2 sets of variables. The result expresses the extent of a linear relationship between two datasets, with a value range from -1.0 to +1.0. A perfect linear relationship is a 1.0. A perfect inverse relationship is a -1.0. This spreadsheet provides an interactive exploration of the concept.

Printer Friendly | Permalink |  | Top
 
evolvenow Donating Member (800 posts) Send PM | Profile | Ignore Sun Dec-12-04 03:38 AM
Response to Original message
41. Cheney was in Hawaii...Several hours time dif. from East coast
Was this on purpose? Was there an advantage to the time difference? Would that allow manipulation of the numbers, with a time displacement? I just keep trying to figure out what he was doing there. Hawaii was very strong in favor of Kerry.
Printer Friendly | Permalink |  | Top
 
seaclyr Donating Member (182 posts) Send PM | Profile | Ignore Sun Dec-12-04 01:29 PM
Response to Original message
42. individual states
My recollection is that there were a significant number of states that eventually went for Kerry that started out with a significant Bush advantage. I have to check on this, but I believe it's correct. At first I thought the change over time reflected the difference between votes coming in from rural/suburban and urban areas, now I wonder whether that's so. It's possible to look at the numbers as they were updated over the night (we have the tape), also to compare the patterns with 2000 (which we don't have yet, but plan to get).
Printer Friendly | Permalink |  | Top
 
TruthIsAll Donating Member (1000+ posts) Send PM | Profile | Ignore Sun Dec-12-04 01:44 PM
Response to Reply #42
43. What do you mean started out with a Bush advantage? The exit polls showed
Edited on Sun Dec-12-04 01:45 PM by TruthIsAll
a Kerry lead in the exit polls and a solid Bush lead in the votes at the same time. That makes no sense. The deviations were biggest in the Democratic eastern states.

In case you missed it: 41 of 51 state votes tallies deviated to Bush (16 beyond the MOE); only ten to Kerry (none beyond the MOE).

I have been posting this fact ad nauseum for weeks.
Printer Friendly | Permalink |  | Top
 
seaclyr Donating Member (182 posts) Send PM | Profile | Ignore Sun Dec-12-04 01:53 PM
Response to Reply #43
44. I mean in the vote count
the vote counts start out heavily for Bush at the start of the evening, sorry if it wasn't clear.
Printer Friendly | Permalink |  | Top
 
rumpel Donating Member (1000+ posts) Send PM | Profile | Ignore Sun Dec-12-04 06:17 PM
Response to Original message
46. TruthIsAll, I think you will like this article
Ohio Recount Affidavit - Richard Hayes Phillips
Monday, 13 December 2004, 10:55 am
Press Release:

OHIO RECOUNT
AFFIDAVIT
December 10, 2004
From: http://web.northnet.org/minstrel/supreme.htm

I, RICHARD HAYES PHILLIPS, do swear and affirm the following:

1. I hold a Ph.D. in geomorphology from the University of Oregon. I am a professional hydrologist and am well versed in standard techniques of statistical analysis, with special expertise in spotting anomalous data. A copy of my curriculum vita is attached to this Affidavit as Exhibit A.

2. I have analyzed unofficial precinct level results from the November 2, 2004 general election in nine Ohio counties, including Cuyahoga, Franklin, Warren, Butler, Clermont, Miami, Montgomery, Hamilton, and Lucas. In have compared these results with those from the November 7, 2000 general election where such data is available. I have examined the unofficial and official results for the November 2, 2004 election, county by county. I have examined, in Franklin County, data on the number of voting machines deployed in each precinct. I have also examined United States census data for 2000 and 2003.

full article at

http://www.scoop.co.nz/mason/stories/WO0412/S00167.htm
Printer Friendly | Permalink |  | Top
 
jkd Donating Member (151 posts) Send PM | Profile | Ignore Mon Dec-13-04 01:39 AM
Response to Original message
47. Actual votes aren't accurate
I spot-checked the actual vote for the mountain states and found that TIA’s totals did not match the %'s found at the Sec. of State web-site for each state. Only Arizona was the same. One state deviated 4.5% MOE, another was over 3%, and the average was 2.4%.
The MOE deviation for the mountain states is close to the 2.7% that TIA attributes to the eastern states. That assumes that TIA's actual vote is accurate for these 21 states. Does this suggest that the Mitofsky exit polls did have a consistent bias in favor of Kerry? Just a thought.
Printer Friendly | Permalink |  | Top
 
TruthIsAll Donating Member (1000+ posts) Send PM | Profile | Ignore Mon Dec-13-04 01:53 AM
Response to Reply #47
48. If that's the case, more evidence of fraud. Actuals are 2-party adj.
Edited on Mon Dec-13-04 02:10 AM by TruthIsAll
Thanks, I will check the latest vote tallies.

But you should be aware that for comparison to the prior Election Model projection, I converted exit polls and votes to 2-party percentages for Kerry vs. Bush (to eliminate Nader et al). The change in deviation is miniscule.

For example, if the vote in state x is 50 Kerry/48 Bush (dev = 2.0%)

Kerry Adj = 50/98 =51.0%
Bush Adj = 48/98 = 48.9%
Dev = 2.1%

Consistent Kerry bias? That's the whole point, isn't it?
The odds will be even less than the 1 in 13.5 trillion odds that the Bush vote deviations from the exit polls could happen by chance.


Printer Friendly | Permalink |  | Top
 
jkd Donating Member (151 posts) Send PM | Profile | Ignore Mon Dec-13-04 02:26 AM
Response to Reply #48
49. One more question
If there is a built-in bias for Kerry in the Mitofsky exit polls, how would one know what the deviation was without seeing the data. The deviation might be much lower and well within the MOE.
Printer Friendly | Permalink |  | Top
 
TruthIsAll Donating Member (1000+ posts) Send PM | Profile | Ignore Mon Dec-13-04 02:43 AM
Response to Reply #49
50. We have already seen the exit poll data, haven't we?
The Kerry exit polls deviated down.
The Bush exit polls deviated up.

The point is, what do you mean by bias?
The exit polls said Kerry would win.
But there was a red shift of 41 states in Bush's direction.

Now, if you think the polling was biased for Kerry, you are entitled to that opinion even though it flies in the face of historic exit poll accuracy.

I believe the deviations were due to fraud, not polling bias.
Why do I believe this? Let me count the ways.

1. Vote suppression.
2. Machines programmed to change a Kerry vote to a Bush vote.
3. Spoiled punched cards.
4. Pre-election polls matching exit polls (Kerry win).
5. Exit poll accuracy.
6. Selection 2000.
7. Jeb Bush
8. The Ohio lockdown.
9. Massive Dem registration.
10. Bush 48% approval
etc
etc
etc
Printer Friendly | Permalink |  | Top
 
jkd Donating Member (151 posts) Send PM | Profile | Ignore Mon Dec-13-04 02:52 AM
Response to Reply #50
51. No faith in Mitofsky
Edited on Mon Dec-13-04 03:24 AM by jkd
Concerning BYU’s exit poll accuracy, Dr. Freeman said this:

“True to their word, predictions in this year’s contests were quite accurate. In the Utah presidential election, for example, they predicted Bush 70.8%, and Kerry 26.5%. The actual was Bush 71.1%, Kerry 26.4%. Consistently accurate exit poll predictions from student volunteers, including in this presidential election, gives us good reason to presume valid data from the world’s most professional exit poll enterprise.”

Mitofsky had Kerry at 30.5%. Isn’t Dr. Freeman contradicting his own argument?

New Hampshire had the largest MOE and the exit polls were wrong. I believe Utah's exit poll was wrong. I have no faith in Mitofsky's exit polls for predicting the outcome of this election.
I believe that there was plenty of vote supression, voter intimidation and perhaps fraud, but your odds may greatly exagerate the problems.
Printer Friendly | Permalink |  | Top
 
TruthIsAll Donating Member (1000+ posts) Send PM | Profile | Ignore Mon Dec-13-04 07:56 AM
Response to Reply #51
54. Calculating the odds is simple. It only depends on how
Edited on Mon Dec-13-04 08:04 AM by TruthIsAll
many states exceeded the margin of error in favor of Bush.
Based on available info, there were sixteen (16).

For N=16, the odds are 1 in 13.5 trillion. 

If the number of states drops from 16 to N, the odds will
change. But they will still be astronomical, in the billions
or millions or thousands, depending on N.

The Probability that at least N= 16 states would deviate
beyond the Exit Poll MOE to Bush, assuming a 3% MOE, is 
7.382983E-14. The Odds are 1 in 13.5 TRILLION. 
			
If we consider that Exit polls are more accurate than public
polls, and assume a 2% MOE, then for 23 states to deviate
beyond 2% the Probability is ZERO. Excel can't compute a
probability when N reaches 18.			

Probability	=1-BINOMDIST(N-1,51,0.025,TRUE)		
			
N	Probability	Odds: 1 out of	
2	0.365526770	3	
4	0.038533663	26	
6	0.001676323	597	
8	0.000037195	26,885	
10	0.000000477	2,098,096	
12	3.816E-09	262,019,924	
14	2.014E-11	49,652,431,051	
16	7.382E-14	13,544,660,533,445	 Actual odds
17	4.996E-15	200,159,983,438,689	
18	0.000E+00	#DIV/0!	Cannot compute
	
So even if N were equal to eight (8), the odds woould be 1 in
2 million.

Long shot. Very long.


Printer Friendly | Permalink |  | Top
 
TruthIsAll Donating Member (1000+ posts) Send PM | Profile | Ignore Mon Dec-13-04 09:13 AM
Response to Reply #54
55. On Edit: Odds 1 in 26,885 for 8 states over MOE; 1 in 2.1 millon for 10
Edited on Mon Dec-13-04 09:14 AM by TruthIsAll
Can't see straight in the AM.
Printer Friendly | Permalink |  | Top
 
jkd Donating Member (151 posts) Send PM | Profile | Ignore Mon Dec-13-04 10:06 AM
Response to Reply #55
56. Go Ohio
I suppose we'll know for sure about Mitofsky when the recounts start again. Then, we'll have more states to base it on than New Hampshire. I'm hoping Ohio will prove the fraud. Go Ohio!
Printer Friendly | Permalink |  | Top
 
DU AdBot (1000+ posts) Click to send private message to this author Click to view 
this author's profile Click to add 
this author to your buddy list Click to add 
this author to your Ignore list Thu Apr 18th 2024, 09:49 PM
Response to Original message
Advertisements [?]
 Top

Home » Discuss » Topic Forums » Election Reform Donate to DU

Powered by DCForum+ Version 1.1 Copyright 1997-2002 DCScripts.com
Software has been extensively modified by the DU administrators


Important Notices: By participating on this discussion board, visitors agree to abide by the rules outlined on our Rules page. Messages posted on the Democratic Underground Discussion Forums are the opinions of the individuals who post them, and do not necessarily represent the opinions of Democratic Underground, LLC.

Home  |  Discussion Forums  |  Journals |  Store  |  Donate

About DU  |  Contact Us  |  Privacy Policy

Got a message for Democratic Underground? Click here to send us a message.

© 2001 - 2011 Democratic Underground, LLC