Democratic Underground Latest Greatest Lobby Journals Search Options Help Login
Google

Prob( Bush Z >1 in 35 states): 1/4500 trillion; Pr (Kerry Z>1 in 5): 91%

Printer-friendly format Printer-friendly format
Printer-friendly format Email this thread to a friend
Printer-friendly format Bookmark this thread
This topic is archived.
Home » Discuss » Topic Forums » Election Reform Donate to DU
 
TruthIsAll Donating Member (1000+ posts) Send PM | Profile | Ignore Sat Apr-23-05 12:08 PM
Original message
Prob( Bush Z >1 in 35 states): 1/4500 trillion; Pr (Kerry Z>1 in 5): 91%
Edited on Sat Apr-23-05 12:28 PM by TruthIsAll
This has been posted as a reply in another thread.

Go here for state Z-scores and corresponding probabilities:
http://www.democraticunderground.com/discuss/duboard.php?az=view_all&address=203x361617

Prior analysis has focused on the probability that 16 states
would exceed the margin of error for Bush, using the standard
95% (actually one-tail 97.5%) confidence level for polling).

This analysis focuses on the Z-score, which is the number of
standard deviations that the actual vote is displaced from the
polling mean, based on the normal distribution (bell-curve). 

The Z-score exceeded one (1) standard deviation (a 68.26%
confidence level, 84.13% for one-tail) in 35 states for Bush
and just 5 states for Kerry.

Calculating the probabilities for each occurrence:
Prob (Bush Z >1 in 35 states): 1/4500 trillion (?); 
Prob (Kerry Z >1 in 5 states): 91% or 9 out of 10 (very
plausible)

To calculate the probability of the Z-score, we use the Excel
function: 
Prob P = 1-NORMSDIST(Z),
where Z = the number of standard deviations, as above.

To calculate the probability of the Z-score exceeding 1 in at
least N states, we use the Excel function:
Prob P(N>Z) =1-BINOMDIST(N-1,50,1/P,TRUE)		

Prob	  Favor N	   Z	Pr(Z)	      Pr(N>=Z)
15.866%	  Bush	35	1.00	1 in 6      1 in 4500 trillion
15.866%	  Kerry	 5	1.00	1 in 6	     90.9%

Probabilities for other Z-score levels:
1.390%	  Bush	16	2.20	72	       1 in 160,000 trillion
0.466%	  Bush	10	2.60	215	             23 trillion
0.040%	  Bush	4	3.35	2475	             165 million
0.009%	  Bush	3	3.75	11307	              74 million
0.002%	  Bush	2	4.10	48382	             1.9 million
					

Using confidence levels of 95% (as in the previous analysis) 
and 99% for the probability calculations, we have:

95% Confidence (Z=1.96):
2.50%	 Bush	16	1.96	40	      1 in 19 trillion

99% Confidence (Z=2.58):
0.50%	 Bush	10	2.58	202	      1 in 13 trillion


Printer Friendly | Permalink |  | Top
Mercury_Rising Donating Member (20 posts) Send PM | Profile | Ignore Sat Apr-23-05 12:20 PM
Response to Original message
1. What does this mean in terms I can understand?
Sorry. Non-math, low-number-comprehension, statistic-challenged.
Can you help me understand this?
Printer Friendly | Permalink |  | Top
 
impeachthescoundrel Donating Member (395 posts) Send PM | Profile | Ignore Sat Apr-23-05 12:27 PM
Response to Reply #1
2. Same here
Mathematically challenged
Printer Friendly | Permalink |  | Top
 
sweetladybug Donating Member (1000+ posts) Send PM | Profile | Ignore Sat Apr-23-05 12:29 PM
Response to Reply #1
3. Please explain. I'm not the brightest crayon in the box haha
Please speak in easy to understand language
Printer Friendly | Permalink |  | Top
 
TruthIsAll Donating Member (1000+ posts) Send PM | Profile | Ignore Sat Apr-23-05 12:34 PM
Response to Reply #1
4. Very quick explanation
I have calculated the probability that Bush (in 35 states) and Kerry (in 5) would exceed their exit poll numbers by 1 standard deviation, a standard statistical measure.

Two standard deviations (95% confidence) are used in polling, but since 42 states deviated to Bush, I calculate the probability of 35 of them exceeding 1 standard deviation(a 68% confidence level).
Printer Friendly | Permalink |  | Top
 
impeachthescoundrel Donating Member (395 posts) Send PM | Profile | Ignore Sat Apr-23-05 12:39 PM
Response to Reply #4
5. Thank you
Printer Friendly | Permalink |  | Top
 
TruthIsAll Donating Member (1000+ posts) Send PM | Profile | Ignore Sat Apr-23-05 04:04 PM
Response to Reply #1
11. COMPLETE STATE EXIT POLL STATISTICAL ANALYSIS
Kerry vote and poll percentages
Vote size in millions

		Vote	Poll	Poll	Std	Exit	Final	Vote	Dev	Odds	Dev
St	Z-Score	Size	Size	MoE	Dev	Poll	Vote	Dev	Prob  	1 in	For
AK	2.44	302	910	3.18%	1.62%	40.14	36.17	-3.97%	0.73%	138	Bush
AL	2.20	1870	730	3.57%	1.82%	41.08	37.08	-4.00%	1.40%	72	Bush
AR	1.64	1998	1402	2.61%	1.33%	46.93	44.74	-2.19%	5.01%	20	Bush
AZ	1.36	1043	1859	2.27%	1.16%	46.60	45.03	-1.57%	8.75%	11	Bush
CA	0.46	12255	1919	2.22%	1.13%	55.73	55.21	-0.53%	32.14%	3	Bush

CO	1.73	2103	2515	1.95%	1.00%	49.07	47.35	-1.72%	4.20%	24	Bush
CT	1.94	1551	872	3.27%	1.67%	58.47	55.24	-3.24%	2.62%	38	Bush
DC	1.02	372	795	1.92%	0.98%	91.63	90.63	-1.00%	15.40%	6	Bush
DE	2.60	224	770	3.48%	1.78%	58.44	53.82	-4.62%	0.46%	216	Bush
FL	2.63	7548	2846	1.84%	0.937%	49.93	47.47	-2.46%	0.43%	231	Bush

GA	1.21	3280	1536	2.48%	1.26%	43.11	41.58	-1.53%	11.33%	9	Bush
HI	0.47	426	499	4.38%	2.23%	53.32	54.37	1.05%	31.86%	3	Kerry
IA	1.13	1494	2502	1.96%	1.00%	50.67	49.54	-1.13%	12.93%	8	Bush
ID	1.32	590	559	3.91%	1.99%	33.33	30.71	-2.63%	9.39%	11	Bush
IL	1.61	5239	1392	2.60%	1.33%	57.13	54.99	-2.14%	5.35%	19	Bush

IN	0.94	2448	926	3.17%	1.62%	40.97	39.46	-1.51%	17.44%	6	Bush
KS	1.27	1171	654	3.65%	1.86%	34.60	36.97	2.37%	10.15%	10	Kerry
KY	0.50	1782	1034	3.00%	1.53%	40.76	39.99	-0.76%	30.92%	3	Bush
LA	1.54	1922	1669	2.38%	1.22%	44.50	42.63	-1.87%	6.22%	16	Bush
MA	2.38	2875	889	3.10%	1.58%	66.46	62.70	-3.76%	0.88%	114	Bush

MD	0.50	2359	1000	3.07%	1.57%	57.04	56.25	-0.79%	30.71%	3	Bush
ME	0.32	727	1968	2.20%	1.12%	54.83	54.48	-0.36%	37.58%	3	Bush
MI	0.81	4793	2452	1.98%	1.01%	52.55	51.73	-0.82%	20.89%	5	Bush
MN	2.67	2792	2178	2.09%	1.07%	54.61	51.76	-2.85%	0.38%	263	Bush
MO	1.07	2715	2158	2.11%	1.07%	47.48	46.33	-1.15%	14.28%	7	Bush

MS	1.88	1130	798	3.44%	1.75%	43.20	39.91	-3.30%	3.00%	33	Bush
MT	0.12	440	640	3.78%	1.93%	39.28	39.51	0.22%	45.40%	2	Kerry
NC	3.35	3487	2167	2.10%	1.07%	47.31	43.72	-3.60%	0.04%	2508	Bush
ND	1.35	308	649	3.63%	1.85%	33.58	36.09	2.51%	8.80%	11	Kerry
NE	2.33	767	785	3.37%	1.72%	36.54	32.53	-4.01%	0.99%	102	Bush

NH	4.16	672	1849	2.27%	1.16%	55.50	50.68	-4.81%	0.00%	63547	Bush
NJ	2.36	3581	1520	2.49%	1.27%	56.13	53.13	-3.00%	0.92%	108	Bush
NM	1.70	748	1951	2.22%	1.13%	51.34	49.42	-1.93%	4.43%	23	Bush
NV	1.83	816	2116	2.13%	1.09%	50.66	48.67	-1.99%	3.33%	30	Bush
NY	4.10	7277	1452	2.47%	1.26%	63.97	58.79	-5.17%	0.00%	49430	Bush

OH	2.94	5599	1963	2.21%	1.13%	52.06	48.75	-3.31%	0.17%	602	Bush
OK	0.24	1464	1539	2.38%	1.21%	34.73	34.44	-0.29%	40.59%	2	Bush
OR	0.49	1810	1064	3.00%	1.53%	51.22	51.97	0.75%	31.32%	3	Kerry
PA	2.89	5732	1930	2.22%	1.13%	54.41	51.13	-3.28%	0.19%	521	Bush
RI	2.23	429	809	3.30%	1.69%	64.24	60.48	-3.76%	1.29%	77	Bush

SC	3.75	1600	1735	2.34%	1.20%	45.79	41.31	-4.48%	0.01%	11104	Bush
SD	1.34	382	1495	2.45%	1.25%	37.42	39.09	1.67%	9.09%	11	Kerry
TN	1.39	2421	1774	2.29%	1.17%	41.15	42.78	1.63%	8.19%	12	Kerry
TX	1.40	7360	1671	2.31%	1.18%	36.84	38.49	1.65%	8.08%	12	Kerry
UT	1.77	905	798	3.18%	1.62%	29.93	27.06	-2.87%	3.84%	26	Bush
VA	1.75	3172	1431	2.59%	1.32%	47.96	45.65	-2.31%	4.01%	25	Bush

VT	2.95	305	685	3.56%	1.81%	65.69	60.34	-5.35%	0.16%	628	Bush
WA	1.36	2815	2123	2.12%	1.08%	55.07	53.60	-1.47%	8.69%	12	Bush
WI	0.01	2968	2223	2.08%	1.06%	50.21	50.20	-0.02%	49.44%	2	Bush
WV	1.43	750	1722	2.35%	1.20%	45.19	43.48	-1.72%	7.61%	13	Bush
WY	1.33	238	684	3.50%	1.78%	32.07	29.70	-2.37%	9.23%	11	Bush

Total	1.33	121055	73607	2.71%	1.38%	48.84	47.00	-1.84%	10.99%	9	
Printer Friendly | Permalink |  | Top
 
Selteri Donating Member (1000+ posts) Send PM | Profile | Ignore Sat Apr-23-05 01:56 PM
Response to Original message
6. Laymen's terms, the chances of the exit polls being
off to the level they are in the areas that they are off is as likely as another planet being in the inner cycle of the planets without having been discovered that doesn't exist hidden in the corona of the Sun.
Printer Friendly | Permalink |  | Top
 
math_is_for_girls Donating Member (6 posts) Send PM | Profile | Ignore Sat Apr-23-05 02:27 PM
Response to Original message
7. statistics
I've been looking at the election results for my state, and I see anomalies, yet my state ranks super-low on the probability scale for fraud given the exit polls. If one was going to do a thorough analysis of a state for the 2004 election, what data and stats would be needed?

How do you correct for a voter bias you know exists - e.g. congress-people get re-elected by large margins of both parties, or some people in a Republican area getting swayed into voting for a Republican?:bounce:
Printer Friendly | Permalink |  | Top
 
LatePeriduct Donating Member (660 posts) Send PM | Profile | Ignore Sat Apr-23-05 05:38 PM
Response to Reply #7
14. That would be in the real sample....
The state exit polls for your state itself, have you read and looked at those?

Now cross compare against the results in the EIRS at http://www.votersunite.org

You have a geographical map for the amount of fraud.

Or as clever James Baker would say....

"All we need is to use encryption on everything, because its obvious by these lousy exit polls our statistics people are doing a bad job......Let's just ensure there is no more voter fraud by encrypting the counted results."
Printer Friendly | Permalink |  | Top
 
TruthIsAll Donating Member (1000+ posts) Send PM | Profile | Ignore Sat Apr-23-05 03:11 PM
Response to Original message
8. In a fraud-free election, expect Z>1 in 16 states, Kerry (8) and Bush (8)
Edited on Sat Apr-23-05 03:24 PM by TruthIsAll
They would fall beyond ONE standard deviation of the exit poll mean on the Normal Distribution curve.

The remaining 34 states where Z <1 would also be fairly evenly split (17 for each). That's reasonable. But...

Bush with a Z-score > 1 in 35 states?

Totally beyond the pale...
which is beyond the pale
which is....
Printer Friendly | Permalink |  | Top
 
Mercury_Rising Donating Member (20 posts) Send PM | Profile | Ignore Sat Apr-23-05 04:52 PM
Response to Reply #8
13. So, this all continues to beg the question: What's to be done?
I know this battle continues to be waged, but more than five months out of the election, there is surely no hope of either exposing specific instances of mass fraud or reversing any "official" results (surely the way I would have engineered it if I were Secretary of Voter Fraud). What's worse is that there's little movement to standardize a fraud-resistant election system.

Also note that in nearly every case where there's even a hint of fraud, the Republicans are the ones who benefit from the error/fraud/theft.

Will we look back someday and say "remember the early part of the decade when power hungry conservatives stole two elections and installed shills at every level of government while large numbers of Americans and the state-sponsored media looked the other way?"
Printer Friendly | Permalink |  | Top
 
dzika Donating Member (1000+ posts) Send PM | Profile | Ignore 
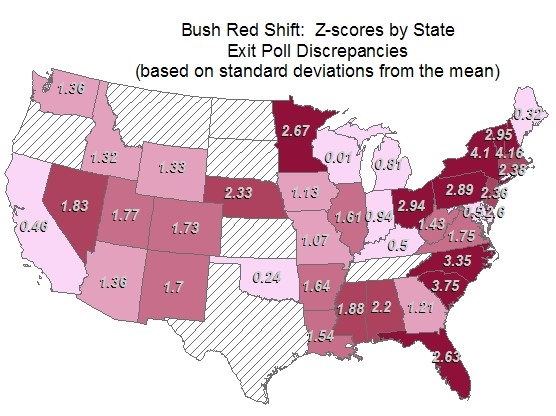
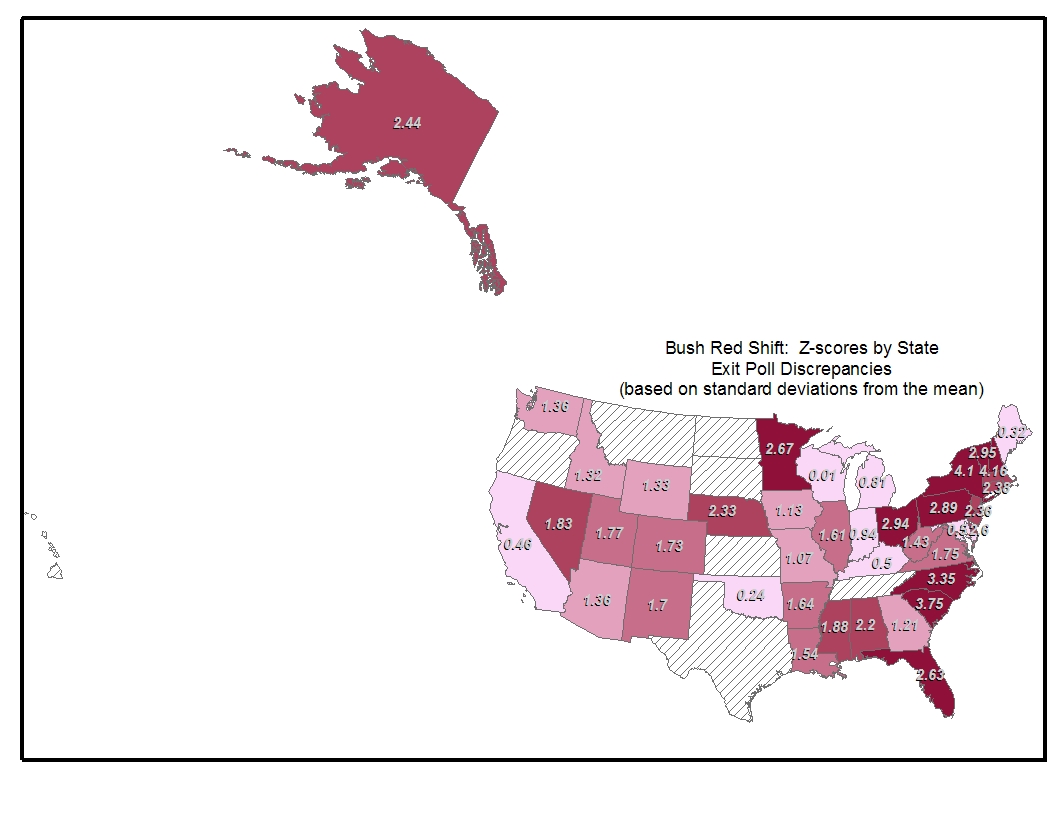
Sat Apr-23-05 03:42 PM
Response to Original message
9. Geographic z-Score Map
Based on the z-scores that TIA published in this thread.


Full map with Alaska

(maybe I should have used red instead of purple for "red shift")

Printer Friendly | Permalink |  | Top
 
berniew1 Donating Member (1000+ posts) Send PM | Profile | Ignore Sat Apr-23-05 03:53 PM
Response to Original message
10. Does anyone know which states are in the 4 NEP regional EP data?
I have the 4 regional NEP samples for East, South, Midwest, West
but don't know which states are represented by each of these,
and which states were actually in the sample for each of these.

Can anyone shed any light on any of this??

Printer Friendly | Permalink |  | Top
 
dzika Donating Member (1000+ posts) Send PM | Profile | Ignore Sat Apr-23-05 04:27 PM
Response to Reply #10
12. States in NEP regions
East		Midwest		South		West

Connecticut Illinois Alabama Arizona
Delaware Indiana Arkansas California
D.C. Iowa Florida Colorado
Maine Kansas Georgia Hawaii
Maryland Michigan Kentucky Idaho
Massachusetts Minnesota Louisiana Montana
New Hampshire Missouri Mississippi Nevada
New Jersey Nebraska North Carolina New Mexico
New York North Dakota Oklahoma Oregon
Pennsylvania Ohio South Carolina Utah
Rhode Island South Dakota Tennessee Washington
Vermont Wisconsin Texas Wyoming
West Virginia Virginia


This table is taken from NEP's "Documentation for the 2004 General Election Exit Polls"
Printer Friendly | Permalink |  | Top
 
TruthIsAll Donating Member (1000+ posts) Send PM | Profile | Ignore Fri May-20-05 07:05 AM
Response to Original message
15. Z-scores + Standard deviations + MoE + Normsdist +Binomdist = FRAUD
/
Printer Friendly | Permalink |  | Top
 
DU AdBot (1000+ posts) Click to send private message to this author Click to view 
this author's profile Click to add 
this author to your buddy list Click to add 
this author to your Ignore list Mon Apr 29th 2024, 12:21 PM
Response to Original message
Advertisements [?]
 Top

Home » Discuss » Topic Forums » Election Reform Donate to DU

Powered by DCForum+ Version 1.1 Copyright 1997-2002 DCScripts.com
Software has been extensively modified by the DU administrators


Important Notices: By participating on this discussion board, visitors agree to abide by the rules outlined on our Rules page. Messages posted on the Democratic Underground Discussion Forums are the opinions of the individuals who post them, and do not necessarily represent the opinions of Democratic Underground, LLC.

Home  |  Discussion Forums  |  Journals |  Store  |  Donate

About DU  |  Contact Us  |  Privacy Policy

Got a message for Democratic Underground? Click here to send us a message.

© 2001 - 2011 Democratic Underground, LLC