| Latest | Greatest | Lobby | Journals | Search | Options | Help | Login |
|
|
|
This topic is archived. |
| Home » Discuss » Topic Forums » Election Reform |
|
| autorank
|
Sat Nov-11-06 03:37 PM Original message |
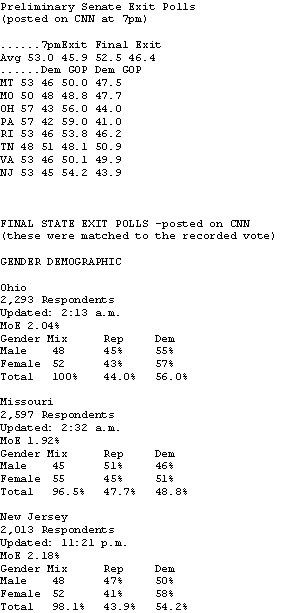
| TRUTHISALL: The 2006 FINAL National Exit Poll does NOT compute - again! |
| Printer Friendly | Permalink | | Top |
| Name removed
|
Sat Nov-11-06 03:41 PM Response to Original message |
| 1. Deleted message |
| autorank
|
Sat Nov-11-06 06:09 PM Response to Reply #1 |
| 25. Live links to graphs from the OP - (the OP is in plain text) |
| Printer Friendly | Permalink | | Top |
| skipos
|
Sat Nov-11-06 03:45 PM Response to Original message |
| 2. Yet, PRE-elections polls in 2006, as in 2004, were pretty consistent with the actual results |
| Printer Friendly | Permalink | | Top |
| OnTheOtherHand
|
Sat Nov-11-06 04:03 PM Response to Reply #2 |
| 10. or arguably Dems got the late surge |
| Printer Friendly | Permalink | | Top |
| autorank
|
Sat Nov-11-06 05:51 PM Response to Reply #2 |
| 22. Take a look at this... |
| Printer Friendly | Permalink | | Top |
| autorank
|
Sat Nov-11-06 06:04 PM Response to Reply #2 |
| 24. Skipos...a response just for you. Kerry lead the pre-electoin polls. |
| Printer Friendly | Permalink | | Top |
| OnTheOtherHand
|
Sat Nov-11-06 06:15 PM Response to Reply #24 |
| 26. and why limit ourselves to likely voters? n/t |
| Printer Friendly | Permalink | | Top |
| Cooley Hurd
|
Sat Nov-11-06 03:50 PM Response to Original message |
| 3. K&R - the numbers are there... |
| Printer Friendly | Permalink | | Top |
| DemBones DemBones
|
Sat Nov-11-06 03:53 PM Response to Original message |
| 4. Anybody here surprised? |
| Printer Friendly | Permalink | | Top |
| No DUplicitous DUpe
|
Sat Nov-11-06 03:55 PM Response to Original message |
| 5. This Preliminary exit poll data from 2004 was all the proof I needed |
| Printer Friendly | Permalink | | Top |
| understandinglife
|
Sat Nov-11-06 03:55 PM Response to Original message |
| 6. Recommended. |
| Printer Friendly | Permalink | | Top |
| mom cat
|
Sat Nov-11-06 07:23 PM Response to Reply #6 |
| 31. Absolutely. Only paper and a million sets of eyes! |
| Printer Friendly | Permalink | | Top |
| tridim
|
Sat Nov-11-06 03:55 PM Response to Original message |
| 7. This also explains the "races tightening" pre-election |
| Printer Friendly | Permalink | | Top |
| Joe Chi Minh
|
Sun Nov-12-06 10:41 AM Response to Reply #7 |
| 57. Why do I have the suspicion that the MSM "prepared the way" |
| Printer Friendly | Permalink | | Top |
| pa28
|
Sat Nov-11-06 03:57 PM Response to Original message |
| 8. We need real election standardization and reform. |
| Printer Friendly | Permalink | | Top |
| The_Warmth
|
Sat Nov-11-06 04:01 PM Response to Original message |
| 9. Great work! |
| Printer Friendly | Permalink | | Top |
| Kurovski
|
Sat Nov-11-06 04:07 PM Response to Reply #9 |
| 11. Done. And bookmarked. |
| Printer Friendly | Permalink | | Top |
| Febble
|
Sat Nov-11-06 04:15 PM Response to Original message |
| 12. Well, I can answer some of these questions |
| Printer Friendly | Permalink | | Top |
| Sancho
|
Sat Nov-11-06 10:08 PM Response to Reply #12 |
| 40. Which is something we've discussed before...where is the precinct data? |
| Printer Friendly | Permalink | | Top |
| autorank
|
Sun Nov-12-06 12:32 AM Response to Reply #40 |
| 44. Sancho, you make a very good point..."if they wanted to." |
| Printer Friendly | Permalink | | Top |
| OnTheOtherHand
|
Sun Nov-12-06 08:09 AM Response to Reply #40 |
| 51. a question of scale |
| Printer Friendly | Permalink | | Top |
| DemReadingDU
|
Sat Nov-11-06 04:16 PM Response to Original message |
| 13. Did other states have thier final exit poll fixed? |
| Printer Friendly | Permalink | | Top |
| applegrove
|
Sat Nov-11-06 04:30 PM Response to Original message |
| 14. Don't you think the early exit polls are day people and the ending ones |
| Printer Friendly | Permalink | | Top |
| Febble
|
Sat Nov-11-06 04:57 PM Response to Reply #14 |
| 18. Not exactly |
| Printer Friendly | Permalink | | Top |
| OnTheOtherHand
|
Sat Nov-11-06 07:09 PM Response to Reply #18 |
| 28. just one more thing about that |
| Printer Friendly | Permalink | | Top |
| Febble
|
Sat Nov-11-06 07:44 PM Response to Reply #28 |
| 34. Thanks |
| Printer Friendly | Permalink | | Top |
| rumpel
|
Sat Nov-11-06 04:41 PM Response to Original message |
| 15. k&r |
| Printer Friendly | Permalink | | Top |
| zeemike
|
Sat Nov-11-06 04:50 PM Response to Original message |
| 16. Perhaps that is why so many close races |
| Printer Friendly | Permalink | | Top |
| progressoid
|
Sat Nov-11-06 04:54 PM Response to Original message |
| 17. Um......What? |
| Printer Friendly | Permalink | | Top |
| elehhhhna
|
Sat Nov-11-06 05:36 PM Response to Reply #17 |
| 19. Nice talk. Read the op again, for comprehension. |
| Printer Friendly | Permalink | | Top |
| OnTheOtherHand
|
Sat Nov-11-06 06:23 PM Response to Reply #19 |
| 27. maybe TIA could use a fact-checker |
| Printer Friendly | Permalink | | Top |
| progressoid
|
Sat Nov-11-06 07:15 PM Response to Reply #19 |
| 30. I read it. It's INcomprehensible. |
| Printer Friendly | Permalink | | Top |
| Febble
|
Sat Nov-11-06 07:43 PM Response to Reply #30 |
| 33. It is also |
| Printer Friendly | Permalink | | Top |
| ProgressiveEconomist
|
Sat Nov-11-06 05:36 PM Response to Original message |
| 20. What do you say about the 'increasing nonresponse bias' alternative |
| Printer Friendly | Permalink | | Top |
| Febble
|
Sat Nov-11-06 05:50 PM Response to Reply #20 |
| 21. Well there is plenty of evidence |
| Printer Friendly | Permalink | | Top |
| ProgressiveEconomist
|
Sat Nov-11-06 07:11 PM Response to Reply #21 |
| 29. Sure, DIFFERENTIAL nonresponse for Rs and Ds would have to be |
| Printer Friendly | Permalink | | Top |
| Febble
|
Sat Nov-11-06 07:28 PM Response to Reply #29 |
| 32. I don't know |
| Printer Friendly | Permalink | | Top |
| ProgressiveEconomist
|
Sat Nov-11-06 07:52 PM Response to Reply #32 |
| 35. Early voting and absentee ballots are other sources of possible |
| Printer Friendly | Permalink | | Top |
| Febble
|
Sat Nov-11-06 08:25 PM Response to Reply #35 |
| 36. Although pollsters |
| Printer Friendly | Permalink | | Top |
| OnTheOtherHand
|
Sat Nov-11-06 08:41 PM Response to Reply #35 |
| 37. two things |
| Printer Friendly | Permalink | | Top |
| ProgressiveEconomist
|
Sat Nov-11-06 11:32 PM Response to Reply #37 |
| 43. 'true believers rightly point out that pre-election polls generally have |
| Printer Friendly | Permalink | | Top |
| OnTheOtherHand
|
Sun Nov-12-06 08:36 AM Response to Reply #43 |
| 52. auditing |
| Printer Friendly | Permalink | | Top |
| bleever
|
Sat Nov-11-06 05:54 PM Response to Original message |
| 23. This would suggest that turnout was sufficient to trump fraud. |
| Printer Friendly | Permalink | | Top |
| melody
|
Sat Nov-11-06 09:07 PM Response to Original message |
| 38. excellent post. thank you n/t |
| Printer Friendly | Permalink | | Top |
| autorank
|
Sat Nov-11-06 10:07 PM Response to Original message |
| 39. For the invisible people...from TruthIsAll |
| Printer Friendly | Permalink | | Top |
| Febble
|
Sun Nov-12-06 06:24 AM Response to Reply #39 |
| 47. Well, since you ask |
| Printer Friendly | Permalink | | Top |
| Sancho
|
Sun Nov-12-06 08:01 AM Response to Reply #47 |
| 50. Again, your explanation seems to avoid the issue for pollsters... |
| Printer Friendly | Permalink | | Top |
| OnTheOtherHand
|
Sun Nov-12-06 09:03 AM Response to Reply #50 |
| 54. great, so offer yourself to conduct the exits |
| Printer Friendly | Permalink | | Top |
| Febble
|
Sun Nov-12-06 09:33 AM Response to Reply #50 |
| 55. There are good answers to your good questions |
| Printer Friendly | Permalink | | Top |
| Sancho
|
Mon Nov-13-06 12:20 AM Response to Reply #55 |
| 88. I think I understand.. |
| Printer Friendly | Permalink | | Top |
| Febble
|
Mon Nov-13-06 03:16 AM Response to Reply #88 |
| 89. Well, again there are some answers here |
| Printer Friendly | Permalink | | Top |
| Time for change
|
Sat Nov-11-06 10:24 PM Response to Original message |
| 41. Can you please clarify? |
| Printer Friendly | Permalink | | Top |
| Awsi Dooger
|
Sun Nov-12-06 07:48 AM Response to Reply #41 |
| 49. Apparently an earlier version of the same exit poll |
| Printer Friendly | Permalink | | Top |
| OnTheOtherHand
|
Sun Nov-12-06 08:58 AM Response to Reply #49 |
| 53. the 7:07 PM national tab was 58-38 |
| Printer Friendly | Permalink | | Top |
| Awsi Dooger
|
Sun Nov-12-06 05:53 PM Response to Reply #53 |
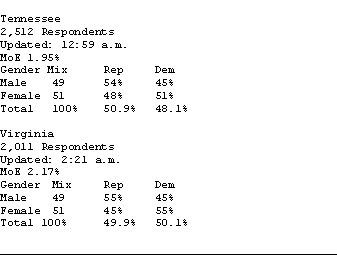
| 82. Some sites had a typo of the Virginia exit poll number |
| Printer Friendly | Permalink | | Top |
| OnTheOtherHand
|
Sun Nov-12-06 06:14 PM Response to Reply #82 |
| 83. I have a similar thought about that weird indy number |
| Printer Friendly | Permalink | | Top |
| philb
|
Sat Nov-11-06 10:54 PM Response to Original message |
| 42. Do the exit polls have info on the undecided Congressional races? |
| Printer Friendly | Permalink | | Top |
| autorank
|
Sun Nov-12-06 05:56 AM Response to Reply #42 |
| 45. Here you go...this should ave some of what you want... |
| Printer Friendly | Permalink | | Top |
| Febble
|
Sun Nov-12-06 06:04 AM Response to Reply #42 |
| 46. autorank's links |
| Printer Friendly | Permalink | | Top |
| In Truth We Trust
|
Sun Nov-12-06 07:27 AM Response to Original message |
| 48. K&R Hand Counted Paper Ballots NOW!!! or fascism forever. Thank you TIA and thank you Michael too! |
| Printer Friendly | Permalink | | Top |
| katinmn
|
Sun Nov-12-06 09:59 AM Response to Original message |
| 56. Thanks TIA and Auto. Thankfully, turnout trumped fraud. |
| Printer Friendly | Permalink | | Top |
| Joe Chi Minh
|
Sun Nov-12-06 10:48 AM Response to Original message |
| 58. You, TIA and all the others working on on the electoral fraud, |
| Printer Friendly | Permalink | | Top |
| civildisoBDence
|
Sun Nov-12-06 11:56 AM Response to Original message |
| 59. A simple explanation, and a simple question... |
| Printer Friendly | Permalink | | Top |
| The Count
|
Sun Nov-12-06 12:09 PM Response to Reply #59 |
| 61. People do not lie about actions they too,. They tried but were watched. |
| Printer Friendly | Permalink | | Top |
| pberq
|
Sun Nov-12-06 12:03 PM Response to Original message |
| 60. Kick & Nominated - let's keep this front and center |
| Printer Friendly | Permalink | | Top |
| slackmaster
|
Sun Nov-12-06 12:25 PM Response to Original message |
| 62. Exit polls were designed to create media content, not to be accurate |
| Printer Friendly | Permalink | | Top |
| Up2Late
|
Sun Nov-12-06 02:04 PM Response to Original message |
| 63. Yup, good thing the MSM agreed, this time, to keep the "exit polls" secret... |
| Printer Friendly | Permalink | | Top |
| Febble
|
Sun Nov-12-06 02:06 PM Response to Reply #63 |
| 64. Except that they didn't.... |
| Printer Friendly | Permalink | | Top |
| Up2Late
|
Sun Nov-12-06 03:06 PM Response to Reply #64 |
| 66. No it wasn't "...like they always do..." Usually the exit poll either leak... |
| Printer Friendly | Permalink | | Top |
| Febble
|
Sun Nov-12-06 03:27 PM Response to Reply #66 |
| 68. Well, you might like to read |
| Printer Friendly | Permalink | | Top |
| Up2Late
|
Sun Nov-12-06 04:43 PM Response to Reply #68 |
| 70. So I guess since YOU posted that info over at DailyKOS it MUST be true!?!? |
| Printer Friendly | Permalink | | Top |
| OnTheOtherHand
|
Sun Nov-12-06 04:54 PM Response to Reply #70 |
| 71. WTF? |
| Printer Friendly | Permalink | | Top |
| Febble
|
Sun Nov-12-06 04:58 PM Response to Reply #70 |
| 73. No, it certainly doesn't make it true |
| Printer Friendly | Permalink | | Top |
| msedano
|
Sun Nov-12-06 02:46 PM Response to Original message |
| 65. thanks for the update and (relative) simplicity |
| Printer Friendly | Permalink | | Top |
| rumpel
|
Sun Nov-12-06 03:22 PM Response to Original message |
| 67. btw |
| Printer Friendly | Permalink | | Top |
| OnTheOtherHand
|
Sun Nov-12-06 03:29 PM Response to Reply #67 |
| 69. snap tallies |
| Printer Friendly | Permalink | | Top |
| rumpel
|
Sun Nov-12-06 04:58 PM Response to Reply #69 |
| 72. In other words, are they tweaking the Exit polls, with the |
| Printer Friendly | Permalink | | Top |
| OnTheOtherHand
|
Sun Nov-12-06 05:06 PM Response to Reply #72 |
| 74. not throughout the day |
| Printer Friendly | Permalink | | Top |
| rumpel
|
Sun Nov-12-06 05:14 PM Response to Reply #74 |
| 75. but we do not tally the races at the precinct in LA county |
| Printer Friendly | Permalink | | Top |
| Febble
|
Sun Nov-12-06 05:20 PM Response to Reply #75 |
| 77. Ah. |
| Printer Friendly | Permalink | | Top |
| rumpel
|
Sun Nov-12-06 05:35 PM Response to Reply #77 |
| 79. To clarify, the only tally we do is the total of ballots |
| Printer Friendly | Permalink | | Top |
| Febble
|
Sun Nov-12-06 05:42 PM Response to Reply #79 |
| 81. It boggles my mind |
| Printer Friendly | Permalink | | Top |
| Febble
|
Sun Nov-12-06 05:15 PM Response to Reply #72 |
| 76. No, I think you are misunderstanding. |
| Printer Friendly | Permalink | | Top |
| rumpel
|
Sun Nov-12-06 05:29 PM Response to Reply #76 |
| 78. So are they basically requesting data from the county database |
| Printer Friendly | Permalink | | Top |
| Febble
|
Sun Nov-12-06 05:39 PM Response to Reply #78 |
| 80. Well, I don't know for sure |
| Printer Friendly | Permalink | | Top |
| autorank
|
Sun Nov-12-06 07:11 PM Response to Original message |
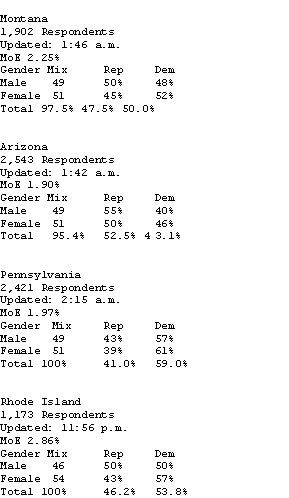
| 84. TIA: National and State Exit Polls on CNN: the numbers were changing. |
| Printer Friendly | Permalink | | Top |
| OnTheOtherHand
|
Sun Nov-12-06 07:52 PM Response to Reply #84 |
| 85. because the tab didn't show Webb +7 at 7 PM |
| Printer Friendly | Permalink | | Top |
| Awsi Dooger
|
Sun Nov-12-06 09:49 PM Response to Reply #85 |
| 87. Maybe someone could upload the screen shot |
| Printer Friendly | Permalink | | Top |
| Awsi Dooger
|
Sun Nov-12-06 08:22 PM Response to Reply #84 |
| 86. OK, I see where TIA got the +7 for Webb |
| Printer Friendly | Permalink | | Top |
| mom cat
|
Sat Nov-18-06 01:31 PM Response to Original message |
| 90. Surprise! Nobody would ever have imagined that such a thing |
| Printer Friendly | Permalink | | Top |
| DU
AdBot (1000+ posts) |
Thu Apr 25th 2024, 10:30 PM Response to Original message |
| Advertisements [?] |
| Top |
| Home » Discuss » Topic Forums » Election Reform |
|
Powered by DCForum+ Version 1.1 Copyright 1997-2002 DCScripts.com
Software has been extensively modified by the DU administrators
Important Notices: By participating on this discussion board, visitors agree to abide by the rules outlined on our Rules page. Messages posted on the Democratic Underground Discussion Forums are the opinions of the individuals who post them, and do not necessarily represent the opinions of Democratic Underground, LLC.
Home | Discussion Forums | Journals | Store | Donate
About DU | Contact Us | Privacy Policy
Got a message for Democratic Underground? Click here to send us a message.
© 2001 - 2011 Democratic Underground, LLC