Environment & Energy
Related: About this forumThe first daily reading above 420 ppm this year has appeared at the Mauna Loa CO2 observatory.
Here's the carbon dioxide readings from the last 5 days:
Mauna Loa Carbon Dioxide Observatory Accessed 1/27/2022.
January 26: 420.52 ppm
January 25: 419.19 ppm
January 24: 419.80 ppm
January 23: 418.96 ppm
January 22: 417.51 ppm
Last Updated: January 27, 2022
It's a little early in the year for the data to break the previous year's record. In weekly data, the time of year that the concentrations pass that of the previous year in a February time frame. For example, in 2021, the record data for 2020, 417.43 ppm recorded for the week beginning May 25, 2020, was not passed until the week of February 28, 2021, when it was 417.97 ppm, going on to rise to 420.01 ppm for the week beginning April 25, 2021.
The data above is daily data, and the weekly data will be an average of as many daily data points are available for the week. If the weekly average exceeds 420.01 ppm in early February, part of the reason may be involved with the European reliance on coal this week given surges in the prices of natural gas. (Recorded european carbon dioxide reductions in recent years are tightly involved with the substitution of Russian gas for coal; the wind blowing regularly also had some] effect, counterbalanced by the German decision to close nuclear plants.)
I have been checking in informally all week on the Electricity Map data for Germany at different points of the day an night. The German carbon intensity for electricity for the entire time, with no exceptions, has been in the high 400s g CO2/kwh to low 500s g CO2/kw, generally running 400% to 500% higher than the carbon intensity of heavily nuclearized France. (Four large French nuclear reactors are off line to replace borated water feed lines as a result of findings in a routine inspection. They are expected to come back on line on March 31.)
There is no joy in the Energiewende world today: The current German carbon dioxide intensity is now (01/27/2022, 12:50P EST (US)) is 475 g CO2/kwh, with coal producing 25.6 GW of electrical power, wind producing 6.20 GW of electricity - 9.68% capacity utilization - and solar producing 0.413 GW of electricity - 0.71% capacity utilization.
France is at 99 g CO2/kwh at this time.
It's not going to be pretty in the climate change data world in 2022. Look for bad times ahead.
 = new reply since forum marked as read
Highlight:
NoneDon't highlight anything
5 newestHighlight 5 most recent replies
= new reply since forum marked as read
Highlight:
NoneDon't highlight anything
5 newestHighlight 5 most recent replies

Magoo48
(4,725 posts)we focus on a dozen avoidance issues.
But, it’s ok, even if every other issue goes our way, we will not look up and truly see. Lots of greenwash will splash here and there, and billions will be wasted on ineffective placebos while Big Oil clowns of the apocalypse keep dancing the greed and profit rumba.

NNadir
(33,587 posts)...for the first time over the last week that I've been checking. It's now 390 g CO2/kwh.
It seems to be a function of the fact that demand is low. Coal has fallen to 10.3 GW from the figures of around 25 - 26 GW I've observed frequently (but randomly) over the last week. Wind is producing 5.02 GW of power, with it's capacity utilization remaining in the single digit area, 7.84%. Solar is of course, before daybreak, producing zero all around.
Temperatures are rather mild in Berlin for winter, 5°C (41°F). The German contribution to climate change seems to have helped them a bit this evening.
Don't get comfortable with Energiewende though, I'm sure, unless the wind starts blowing, the Germans will be burning lots more coal over the next few days.
French electricity is at 103 g CO2/kwh.
NNadir
(33,587 posts)German wind capacity utilization is now at 45.28% after a week of Dunkelflaute and carbon intensities in the high 400s of grams CO2/kwh to low 500s of g CO2/kwh.
At 320 g CO2/kwh, in percent talk, Germany is only 320% worse than France. As of this writing, heavily nuclearized France is at 100 g CO2/kwh.
Congrats to Germany on having the wind blow again. I don't want to only say what's going on when the wind doesn't blow in Germany, but also what's going on when it does blow.
They're still burning coal though, the results of which will remain with humanity, well, forever.
NNadir
(33,587 posts)As of this writing, Germany's carbon dioxide intensity is 298 g CO2/kwh. Wind is providing 35.8 GW of instantaneous power 55.86% capacity utilization.
Electricity Map Germany (3:39 AM 1/29/2022, 9:39 AM Saturday 1/29/2022 Berlin Time)
Coal is providing 19.6 GW of electricity, the first time I've seen it fall below 20 GW of electricity in the last week during random check-ins
It appears from other sources that currently the form of coal that Germany is burning is, in fact, lignite, although it is importing some bituminous coal.
We have from this source, an account of deaths per GWh for major contributors to electrical generation:
Anil Markandya, Paul Wilkinson, Electricity generation and health, The Lancet, Volume 370, Issue 9591, 2007, Pages 979-990.
Here's table 2: 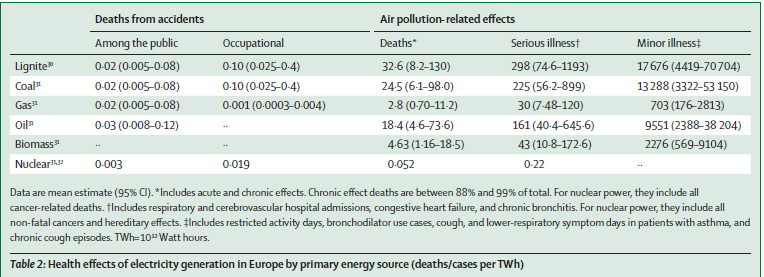
For coal (presumably bituminous and anthracite), 19.6 GWh (24 hour period), the estimated death toll for German electricity will average11.5 deaths/day, which would annualize to around 4200 deaths per year.
For lignin, the corresponding figure for 19.6 GWh (24 hour period) the estimated death toll for German electricity will average 15.3 deaths/day, which would annualize to around 5600 deaths per year.
Heavily nuclearized France, the next door country to Germany, has a carbon intensity of 75 g CO2/kwh. France is producing 47.8 GW as of this writing using nuclear energy.
Using the Lancet figures above, French nuclear electricity works out to an average of 0.06 deaths per day, annualized to 22 deaths/year.
Germany has been telling the rest of Europe, which apparently couldn't care less, that nuclear energy is "too dangerous."
In the best case, if the wind blew constantly and Germany "only" used 19.6 GW of coal electricity continuously, producing "only" 5600 deaths per year, the excess deaths from the German declaration that nuclear power is "too dangerous" would be 5580 deaths per year, rounding the French death toll to 20 deaths/year to respect that the Lancet figures are estimations.
However, 19.6 GW is the lowest figure for coal based electricity I've seen in random checks.
Numbers don't lie, but apparently the people deciding official German energy policy do.

In defence of wind, in cases where there's a good amount of hydro, they can work together to give pretty low fiures for g CO2/KWh. Uruguay, Costa Rica, and parts of Brazil often have emissions lower than France does. On the other hand, comparing the amount of power these grids are producing with the population, they're running at fairly low energy levels by European standards. South Australia also manages figures on a par with France or Sweden sometimes - at any rate, always much better than coal-heavy Queensland, New South Wales and Victoria. In my own country, NZ ( which has lately dropped off the Electricity Map radar ) hydro dropped from 90% of generation about fifty years ago to around half now, as population and demand rose. Geothermal, nuclear for dummies, makes around 20%. A government study in the 60s predicted nuclear would be needed by about the turn of the century, once we'd burnt most of our gas. Instead we're importing Indonesian coal in dry years, like the last one.
NNadir
(33,587 posts)...morning has a carbon dioxide intensity of just 34 g CO2/kwh. (8:03 AM EST US, 2:02 PM, 14:02 Uppsula, Sweden 1/30/22)
The wind capacity utilization is very high (for wind), 79.18%; one almost never sees this kind of capacity utilization for wind. It is producing 8.77 GW of electricity.
What the wind industry in Sweden is producing next week, tomorrow, on three weeks from now is uncertain, however. Just as Germany experienced dunkelflaute, so can Sweden.
Sweden's nuclear plants are producing 6.97 GW of electricity, operating at 101.46% capacity utilization (in cold weather the efficiency of nuclear plants is high, and they can operate above rated capacity.) They can operate at these high capacity utilizations indefinitely, stopping only occasionally for refueling and maintenance.
There are six reactors operating in Sweden as of now. All came on line in the 1980's. They are dependable and predictable.
Swedish nuclear reactors.
Six buildings are reliably and predictably producing as much electricity as all the wind turbines in Sweden, spread over God knows how many sq km.
All of Sweden's wind turbines will need to be replaced in the next 20-25 years. The blades, which cannot be recycled and are loaded with resin, will all be landfill, and all of the replacements will require huge diesel trucks, and huge amounts of energy to recycle what can be recycled. Every wind turbine in Sweden is thus a liability for which every infant and toddler in the country will need to pay early in their careers. There is also the long term issue of the microplastics shed by these awful wind machines during operation.
Sweden is also laced with hydroelectric dams. Although they may operate for a very long time, since they depend on the weather, my opinion is that they should also be replaced with nuclear plants, in particular to restore the ecosystems they damaged.
There is nothing, absolutely nothing, as sustainable and as low risk as nuclear energy, nothing.
Sweden could actually lower its carbon intensity, right now near the best in Europe, by going 100% nuclear. They were able to build reactors, using 1980's technology, in about 5 to 7 years.
NNadir
(33,587 posts)...intensity as of this writing, (10:00 AM EST US Sunday 1/30/22, 4:00 PM 16:00H Berlin time) is "only" 235% (in "percent talk" ) greater than that of France.
German carbon intensity: 176 g CO2/kwh
French carbon intensity: 75 g CO2/kwh.
Germany is producing 44.1 GW of instantaneous wind power, 68.92% capacity utilization.
They are producing "only" 10.5 GW of coal power.
If the wind keeps blowing at this intensity - it won't, but as always with so called "renewable energy" let's play "pretend" - the death toll for lignite coal would represent 8 deaths per day, annualized to around 3000 deaths/year; for bituminous or anthracite coal, 6 deaths per day, annualized to around 2300 deaths per year.
Were this energy produced instead by nuclear energy using the a few of the nuclear power plants Germany shut because in their (obviously confused) minds nuclear power is "too dangerous," the average death toll would amount to an average 0.013 deaths/day, annualizing to about 5 deaths.
These calculations are, as always, based on the data in this paper, on the data in Table 2.
Anil Markandya, Paul Wilkinson, Electricity generation and health, The Lancet, Volume 370, Issue 9591, 2007, Pages 979-990.
Here's table 2:
These figures were far uglier last week, when the wind wasn't blowing in Germany.
The weekly average reading at the Mauna Loa carbon dioxide observatory for the week beginning January 23, 2022 is shown below, copied directly from the observatory's web page, accessed 01/30/22:
Weekly value from 1 year ago: 416.04 ppm
Weekly value from 10 years ago: 393.57 ppm
Last updated: January 30, 2022